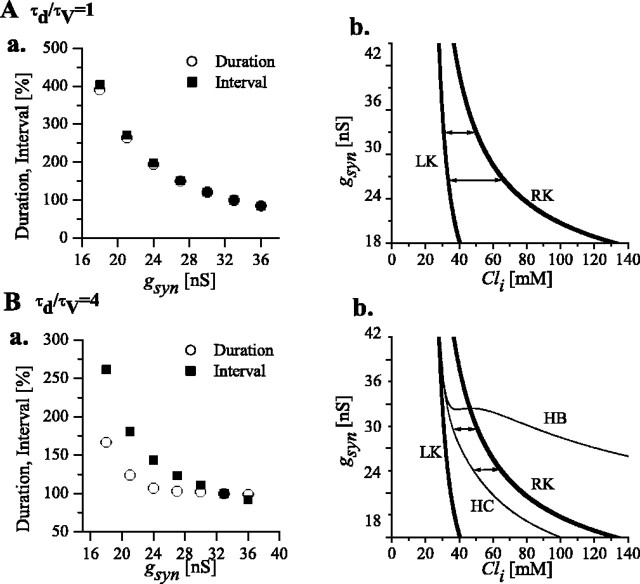
Figure 5.
Dependence of interval and duration of episodes on gsyn and τd/τv. A, τd/τv = 1. a, Duration (open circles) and interval (filled squares) of episodes obtained from simulations for different gsyn values. Data for duration (interval) is normalized to the duration (interval) value at gsyn = 33 pS (control value, also used in Fig. 6). b, Two-parameter response diagrams show how the right knee and the left knee shift with gsyn. The bistability range (range of values covered by Cli during episodic behavior) increases with decreasing gsyn; consequently, both interval and duration increase with decreasing gsyn. Double arrows indicate the Cli range covered during episodic activity, for two values of gsyn (33 and 27 nS). B, τd/τv = 4. a, Duration and interval for different gsyn values. b, Two-parameter response diagrams show how the RK and LK (thick lines) and the HC and HB (thin lines) shift with gsyn. Contrary to the previous case, Cli covers the range between HC and RK during episodic activity (double arrows; shown for gsyn = 33 and 27 nS). With decreasing gsyn, this range does not increase as much as in A, so interval and durations are less affected.

