
Figure 3.
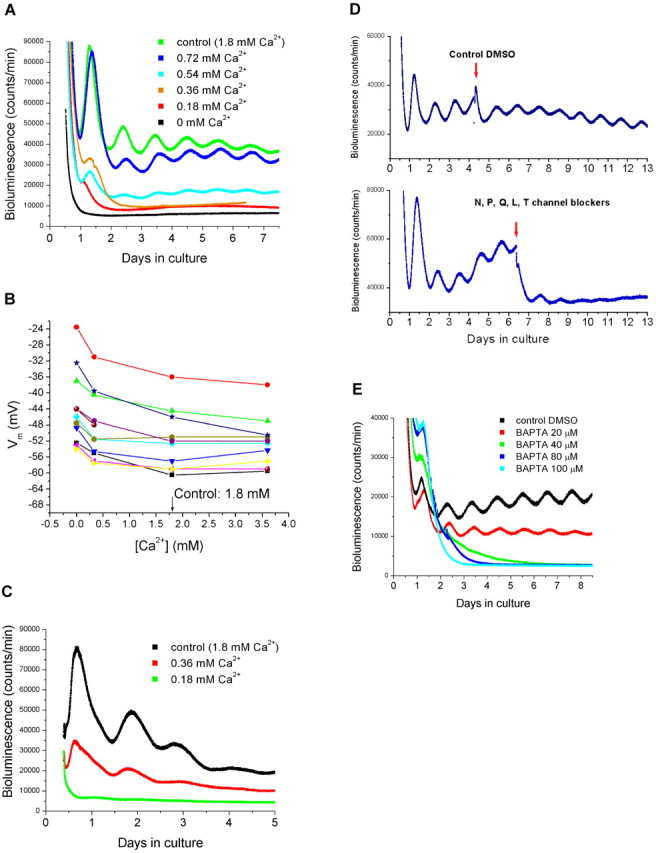
Recordings of membrane potential and bioluminescence in various concentrations of Ca2+. A, Bioluminescence recordings from SCN explants obtained from transgenic Per1-luc rats. The explants were cultured in medium containing 0, 0.18, 0.36, 0.54, 0.72, or 1.8 mm (control) Ca2+. B, Current-clamp recordings in recording solutions containing 0, 0.33, 1.8, and 3.36 mm Ca2+. Each color represents recorded membrane potentials in a single SCN neuron in various concentrations of Ca2+. C, Bioluminescence recordings from liver explants obtained from Per1-luc rats. Liver tissues were cultured in medium containing 0.18, 0.36, or 1.8 mm Ca2+. D, Effect of Ca2+ channel antagonists on the SCN Per1-luc rhythm. SCN explants were cultured in control medium. After 3-5 d in culture, a DMSO control (top trace) or a mixture of Ca2+ channel blockers specific to N-, P-, Q-, L-, and T-types (bottom trace) was added (indicated by arrows) to the explants. E, The intracellular Ca2+ chelator BAPTA-AM (20, 40, 80, and 100 μm) was added to SCN explants, and bioluminescence was recorded. DMSO was added as a control.