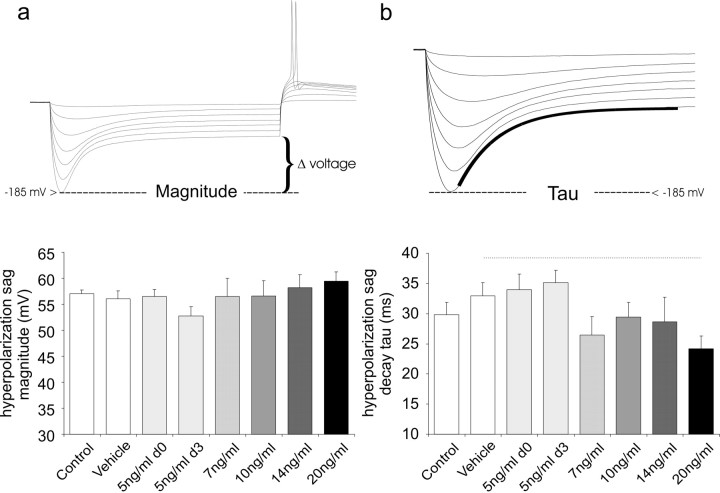
Figure 5.
The voltage sag in response to hyperpolarizing step current injections did not show robust changes with NT-3 application. a, Measurements of the differences in the voltage between the nadir (at -185 ± 3 mV) and the plateau levels was used to determine the magnitude of the voltage sag. No significant differences were noted between the conditions. b, The time course of the voltage sag was measured by fitting a single exponential to traces with nadirs at -185 ± 3 mV. A strong relationship between NT-3 concentration and the time course of this time-dependent voltage change was not observed. Error bars represent SEM.

