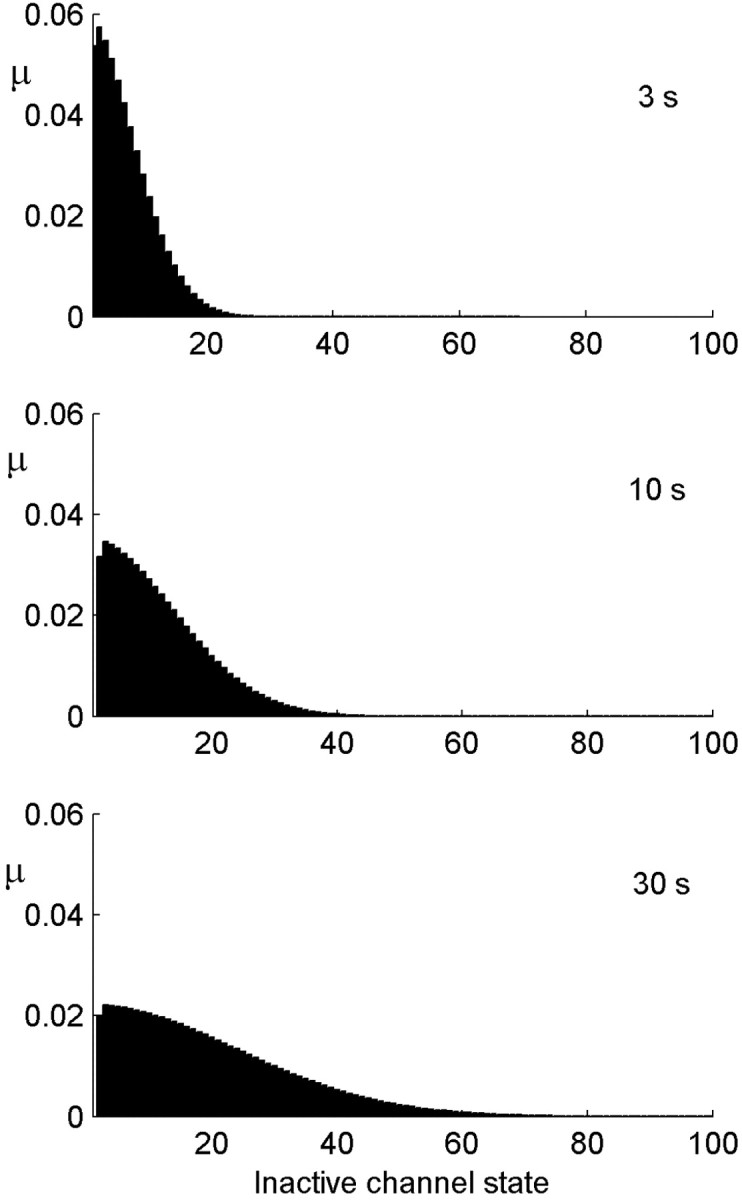
Figure 7.

Distribution of the channels among the inactive states after different stimulus durations. The distribution becomes broader as the stimulation duration increases. The population at the origin itself is stable at a value of ∼0.5 (data not shown). Parameters:α0 =β = 20 Hz; σ = 0.1; cA = 1/2.
