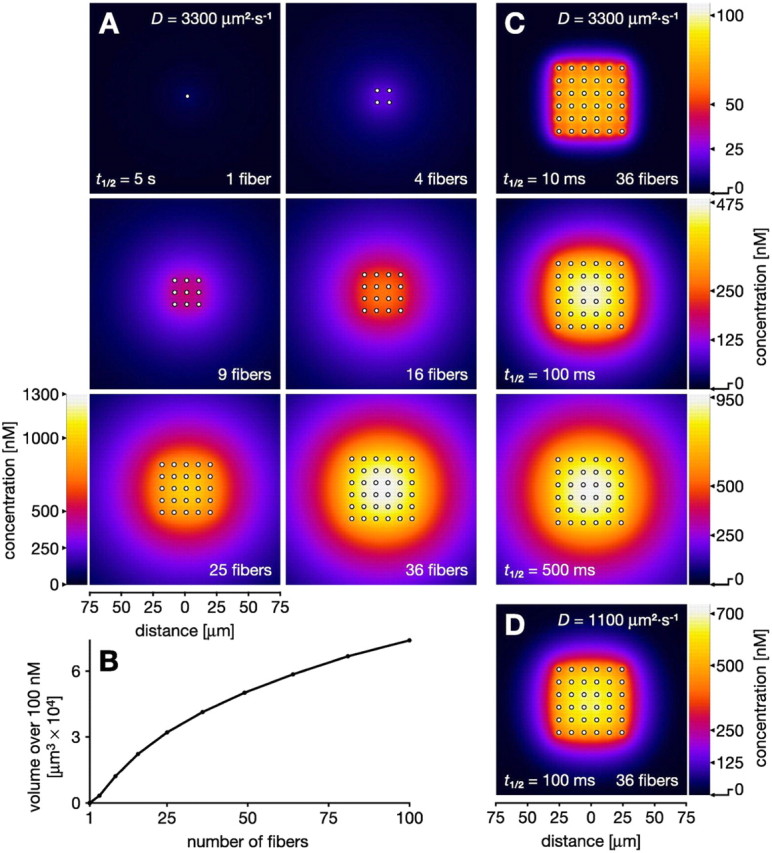
Figure 4.

Cooperative volume signals produced by ordered arrays of parallel NO-synthesizing fibers after 1 s of synthesis. Fiber diameters (2 μm) and spacing (10 μm) approximate that in the locust optic lobe (Elphick et al., 1996). A, Concentration distribution of NO in 300 × 300 μm2 slices across increasing numbers of active fibers (indicated by white dots). A single fiber is a relatively ineffectual NO source (1 fiber in A). Increasing numbers of fibers separated by 10 μm result in a cumulative buildup of NO to substantial concentrations (4-36 fibers in A). B, As the number of fibers increases, so does the volume that is affected by an NO signal over a particular concentration, here 100 nm. C, Cooperative generation of a volume signal is robust to variation in half-life (t1/2) within the limits reported in the literature. When t1/2 is reduced to 100 ms (Griffiths and Garthwaite, 2001), 1/50 of the value in A, the concentrations in the target volume fall to only approximately one-third (250-475 vs 700-1300 nm). Further reduction of t1/2 to 10 ms yields a more spiky concentration distribution with 100 nm peaks at the fibers. However, at least 50% or more of this peak concentration is still reached everywhere throughout the target volume. D, Strong cooperation is still observed when t1/2 is relatively short (100 ms) and D is reduced to 1100 μm2 · s-1, one-third of its standard value. Compared with the result with standard D (middle part of C), the volume signal shows less encroachment into areas outside the array.
