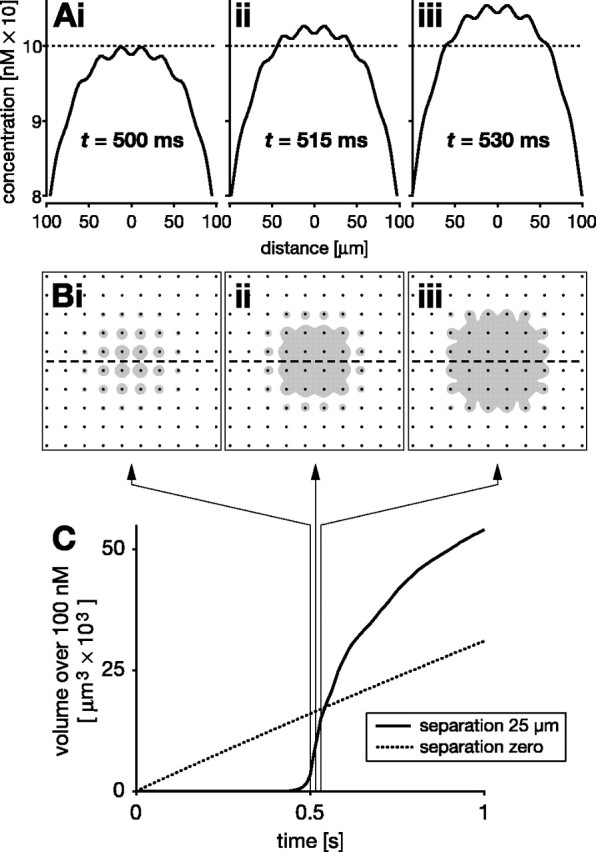
Figure 7.

Delayed volume signaling by separated NO sources (10 × 10 array of 1-μm-diameter NO-synthesizing fibers separated by 25 μm). A, B, Spatial concentration distributions at three time points after the onset of synthesis: 500 ms (i), 515 ms (ii), and 530 ms (iii). A, NO concentration profiles across the center of the array, along the dashed line in B. For illustrative purposes, a nominal threshold concentration of 100 nm is assumed (dotted line in A). B shows the region over 100 nm (gray) in cross sections through the array (fibers are indicated by black dots). There is a substantial delay between the onset of synthesis and NO reaching 100 nm anywhere within the volume of the array. After 500 ms of continuous synthesis (i in A, B), NO reaches 100 nm in the vicinity of central fibers. Additional synthesis pushes a large part of the target volume near simultaneously over 100 nm (ii, iii in A, B). C, Plotting the volume that experiences >100 nm NO over time shows a sharp, nonlinear rise after an initial delay of ∼500 ms (solid line). Three hairlines with arrows indicate the time points shown in A and B. Also shown for comparison is the near-linear rise (dotted line in C) that is observed for the volume over 100 nm when the same 10 × 10 fibers are arranged contiguously as a single source.
