
Figure 3.
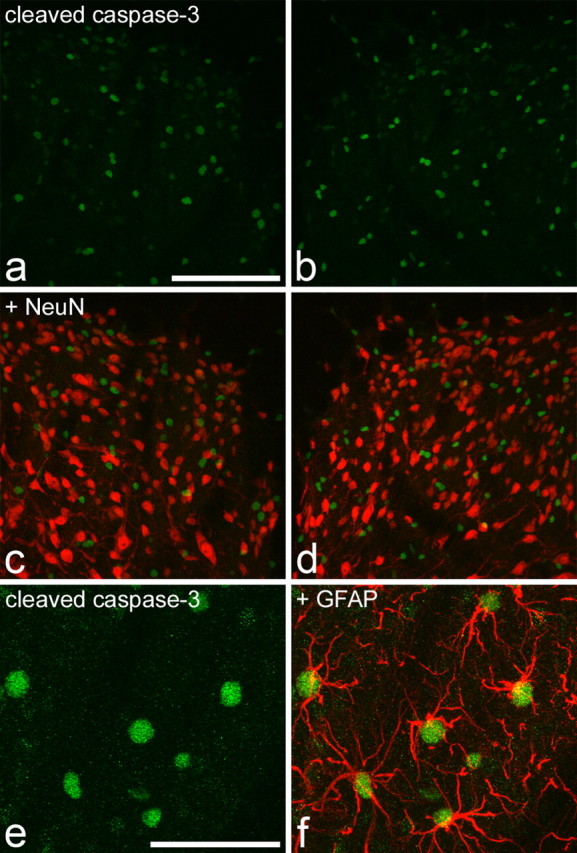
Cleaved caspase-3 immunoreactivity in the spinal cord of rats that had undergone SNI 7 d previously. a and b show staining for cleaved caspase-3 (green) in the medial part of the ipsilateral (a) and contralateral (b) dorsal horn. Numerous immunostained profiles are visible. c, d, Merging these images with NeuN staining (red) shows that the nuclei with strong or moderate immunoreactivity for cleaved caspase-3 are not NeuN positive. The rare instances of yellow in the merged images result from overlap of structures that are in different z-sections. e, f, Part of the ipsilateral dorsal horn from another rat that had undergone SNI. This section has been reacted sequentially with antibodies against cleaved caspase-3 (green) and GFAP (red). The nuclei with strong caspase immunoreactivity are surrounded by GFAP staining and can therefore be identified as astrocytes. Scale bars: (in a) a-d, 100 μm; (in e) e, f, 50 μm. Images are projected from 21 (a-d) or 15 (e, f) z-sections at 1 μm separation.