
Figure 2.
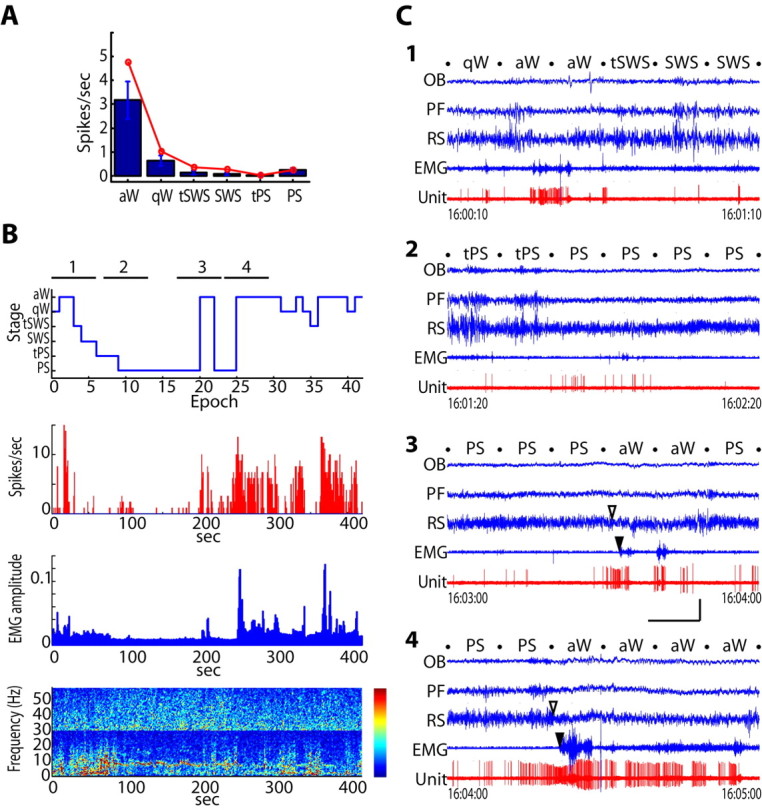
Discharge of Nb+/Orx+ neurons across sleep-wake states. A, Bar graph showing mean spike rate (in blue with SEM) that varied significantly as a function of sleep-wake stage across cells (n = 6; F = 16.05; df = 5, 25; p = 0.007). The rate during aW was significantly higher than that during qW and all sleep stages, including PS (p < 0.05). The line graph (in red) shows the discharge rate of the Nb+/Orx+ neuron (#c32u10) shown in B and C. B, Hypnogram, spike rate histogram, and EMG amplitude and EEG frequency spectra (split for different scaling from blue to red over the lower frequency range, 0-30 Hz from 1 to 100 uV, and gamma range, 30-60 Hz from 0 to 25 uV) over the recording session (of 400 s corresponding to 40 10 s epochs). C, Four 1 min segments (as indicated by time below) of unit, EEG, and EMG activity during state transitions: from qW through aW, tSWS to SWS (supplemental video 1, available at www.jneurosci.org as supplemental material) (1), from tPS to PS (supplemental video 2, available at www.jneurosci.org as supplemental material) (2), from PS through aW back to PS (supplemental video 3, available at www.jneurosci.org as supplemental material) (3), and from PS to aW (supplemental video 4, available at www.jneurosci.org as supplemental material) (4). Stages were scored per 10 s epoch as indicated by the stage names between dots marking the epochs. Note that the unit fires during aW (in 1) becomes quiet during SWS (in 1) and PS (in 2 and 3), except for occasional spikes sometimes associated with twitches (in 2) or a brief arousal (in 3). The increase in firing before arousal from PS (in 3 and 4) anticipates the transition from PS to aW judged by EEG (open arrowhead) and also EMG (filled arrowhead). Calibration: horizontal, 10 s; vertical, 1 mV for EEG, 0.5 mV for EMG, and 2 mV for unit. OB, Olfactory bulb; PF, prefrontal cortex; RS, retrosplenial cortex.