
Figure 3.
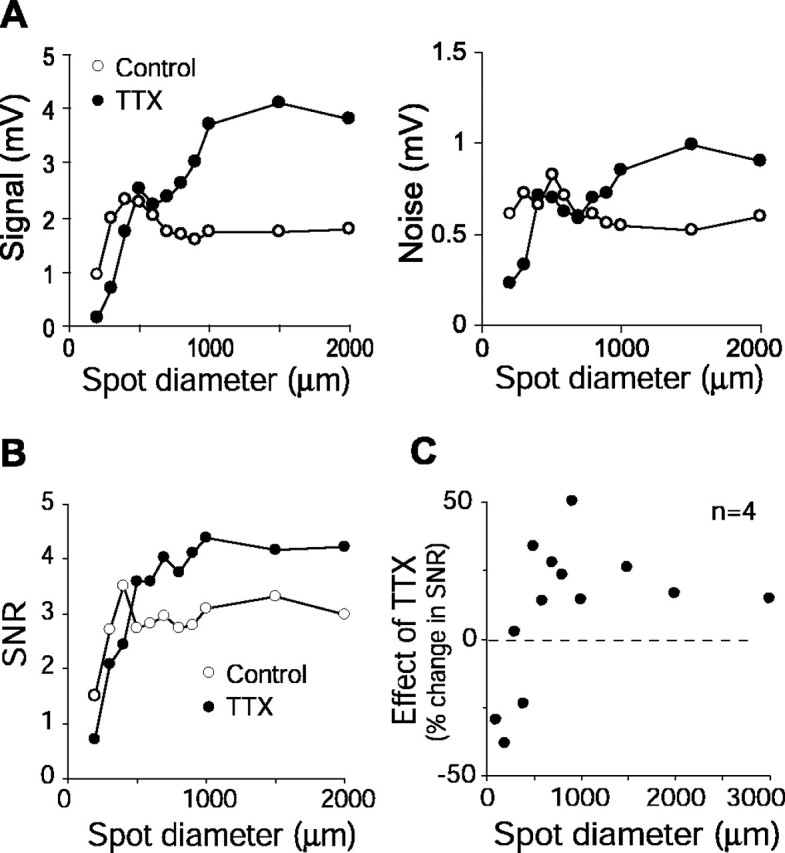
TTX reduced the SNR in the graded potential response for a small center spot but increased the SNR for a larger spot that covered the surround. A, Effect of TTX on signal (left) and noise (right) as a function of spot diameter for a representative cell. For a small spot (≤400 μm diameter, 50% contrast), TTX resulted in lower signal and lower noise, but as the spot enlarged, TTX produced higher signal and higher noise. The effects on signal were more pronounced than on noise. B, Effect of TTX on the SNR (same cell as shown in A). Because of the bigger effect of TTX on signal than on noise, the SNR declined with TTX for small spots but increased for larger spots. C, Data from four cells showing that TTX reduced the mean SNR for small spots but increased SNR for larger spots. Spot contrast, 50% (n = 2), 100% (n = 2). Error bars have been removed for clarity.