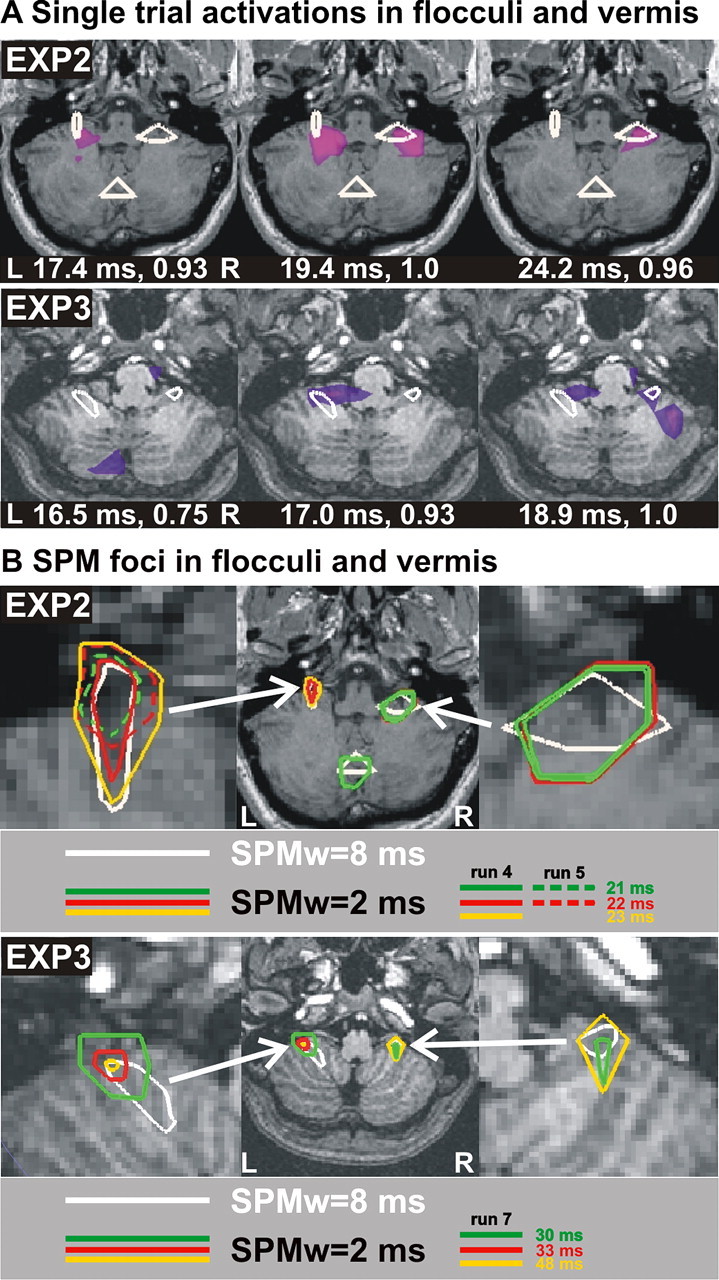
Figure 7.

Cerebellum spike activity and SPM foci shown on axial MRI cuts at the level of the flocculi and the dorsal vermis. A, Peaks of activity from a single trial of saccade from center to right. The top half shows peaks of activity for a trial from EXP2, type 4, run 4 at 17.4, 19.4, and 24.2 ms. The MFT result shown in pink/purple is normalized in strength to 1 (middle panel). White contours are early significant SPM foci using an 8 ms window with pre-EXP as baseline. The bottom half shows the same for a trial for saccade to the left from EXP3, type4, run 6 at 16.5, 17, and 18.9 ms. Note that the single-trial activations for both EXP2 and EXP3 show rapid interplay between the flocculi whose positions are in good agreement with both the anatomical definition and the SPM results. B, SPM foci for saccades from center to left in type 4 runs. Top, EXP2, type 4, runs 4 and 5, with a 2 ms window and the presaccadic period (–190 to –160 ms) as baseline. For reference, white contours in A are included. Green centered at 21 ms, red at 22 ms, yellow at 23 ms, all showing precise localization at the flocculi and vermis. Solid color contours are SPM results from run 4, and dotted ones are from run 5, showing rapid habituation of vermis and right flocculi leaving only the ipsilateral (left) floculus SPM focus. Bottom, The same arrangement for EXP3, type 4, run 7, bilateral flocculi are seen active at 30 ms, at 33 ms only in the left flocculus, and at 48 ms in both flocculi again. L, Left; R, right.
