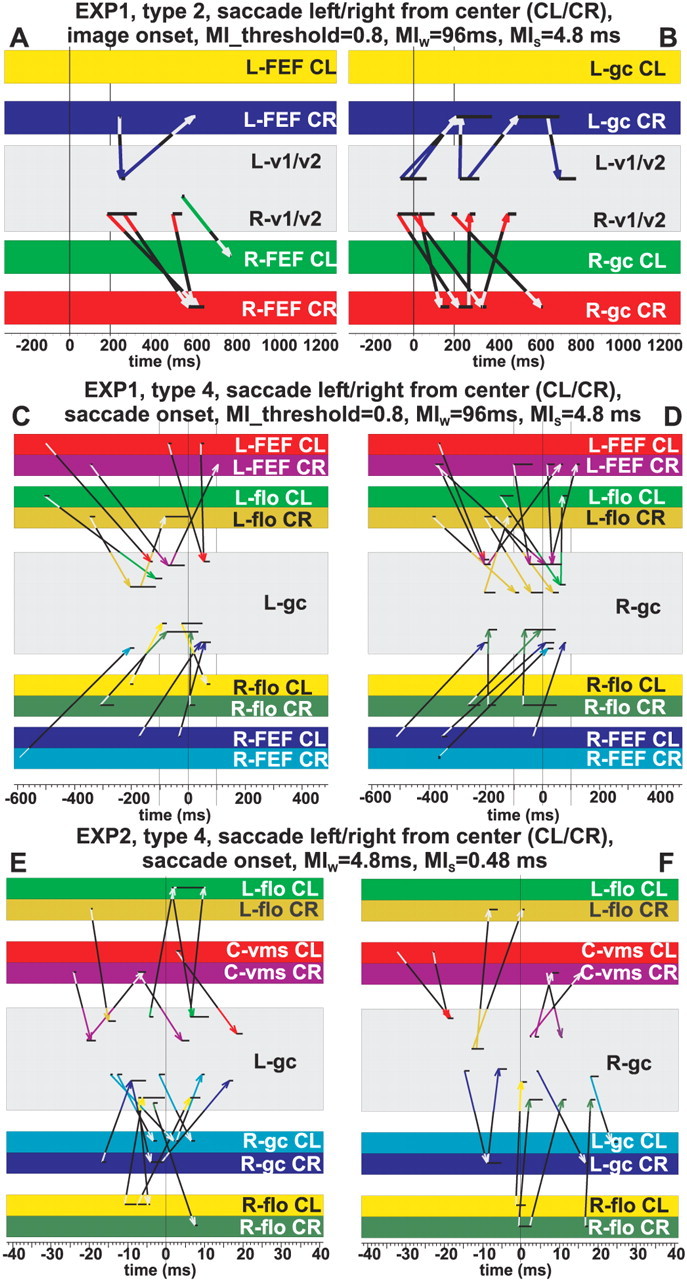
Figure 9.

Influence diagrams showing linked activity between areas in the cortex, cerebellum, and brainstem for EXP1 and EXP2. The MI threshold, window length MIw and step MIs, are printed above each diagram. A, B, Linked activity between V1/V2 and frontal eye fields (left) and gaze centers (right) from –300 to 1300 ms relative to cue 4 (specifying saccade direction) onset, from type 2 GO trial sin EXP1. C, D, Linked activity between left gaze center and frontal eye field, flocculi (left), and between right gaze center and frontal eye field, flocculi (right) from –600 to 500 ms relative to saccade onset, from type 4 GO trials in EXP1. E, F, Linked activity between left gaze center and flocculi, vermis, right gaze center (left), and between right gaze center and flocculi, vermis, left gaze center from –40 to 40 ms relative to saccade onset, from type 4 GO trials in EXP2. For this diagram, the MI threshold for displaying a link was set to MI values greater than mean + 4 SDs of the MI values from the corresponding type 3 trials.
