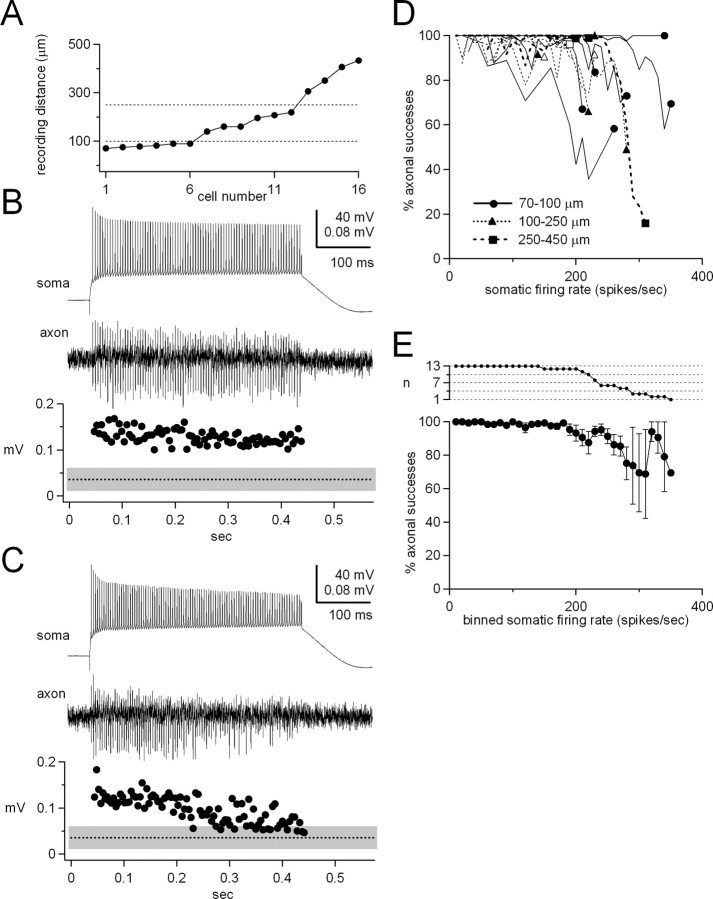
Figure 2.
Reliability of simple spike propagation. A, Summary of axonal recording distances for each cell. Dotted lines indicate boundaries between close, mid-range, and distant recordings. B, C, Somatic and axonal recordings of simple spikes, with plots of axonal signal and noise amplitudes as in Figure 1. The axonal electrode was 90 μm from soma. Tonic hyperpolarizing current held the cell near -70 mV. Spikes were evoked by 400 msec current injections, and firing rates were 207 spikes/sec (B) and 231 spikes/sec (C). Percentage propagation was 100% (B) and 87% (C). D, Percentage axonal successes versus somatic firing rate for 16 cells. Recording distances are as labeled. Filled symbols indicate data from cells driven to their maximal somatic firing rate (n = 13); open symbols indicate cells not driven to their maximal firing rates (n = 3). E, Data from the 13 cells driven to maximal rates in D, binned and averaged; bin width = 10 spikes/sec. Inset graph, Number of cells that fired at each rate.

