
Figure 2.
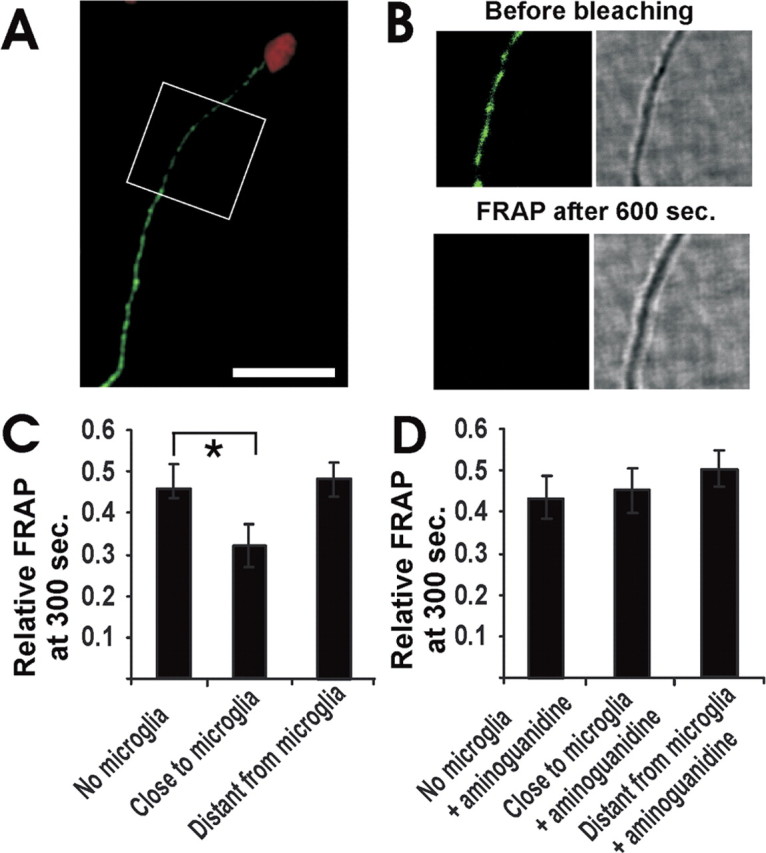
Impaired axonal movement of synaptophysin-EGFP near cytokine-stimulated microglia. a, Cultured hippocampal neurons were transfected with synaptophysin-EGFP. Axon of a neurontransfected with synaptophysin-EGFP (green) and challenged with cytokine-stimulated microglia (red) is shown. Area of FRAP analysis as indicated. Scale bar, 20 μm. b, Fluorescence and transmission images from an axon of a neuron transfected with synaptophysin-EGFP (green) and challenged with a cytokine-stimulated microglia (see area of FRAP analysis in A). Fluorescence and transmission images before bleaching and 600 sec after bleaching are shown. Total size of images: 20 × 20 μm. c, Relative FRAP at 300 sec of axonal segments close to or distant from (>50 μm distance) microglia prestimulated by the cytokines IFN-γ (100 U/ml) and IL-1β (10 ng/ml) for 72 hr. Data are presented as mean ± SD. For each experimental condition, n > 3. *p < 0.01. d, Relative FRAP at 300 sec of axonal segments close to or distant from (>50 μm distance) a cytokine-stimulated microglial cell. The microglia or the neurons were pretreated with the NO synthase inhibitor aminoguanidine (2 mm). Data are presented as mean ± SD. For each experimental condition, n > 3.