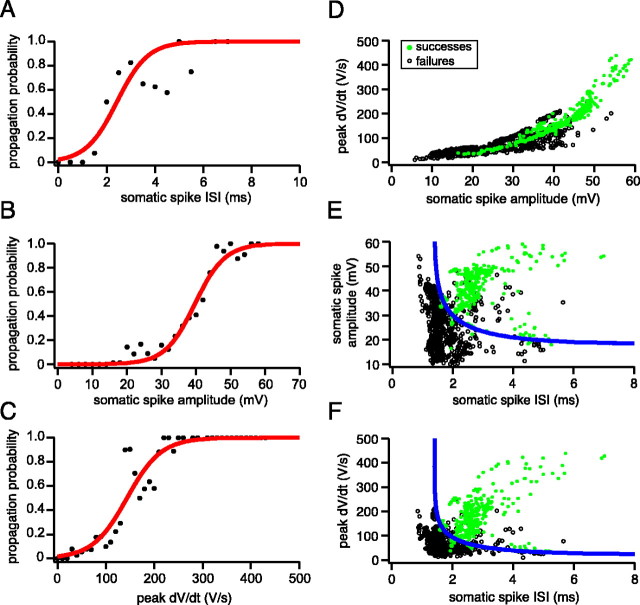
Figure 9.
Somatic spike parameters predict axonal propagation of the complex spike. A, Probability of axonal propagation plotted against the preceding somatic ISI (pooled data from 7 cells). B, Probability of axonal propagation plotted against the amplitude of the corresponding somatic spikelets (pooled data from 7 cells). C, Probability of axonal propagation plotted against the peak dV/dt of each somatic spikelet (pooled data from 7 cells). The data points in A-C have been fit with a sigmoidal function. D, Plot of peak dV/dt against somatic spike amplitude. The data points are color-coded to indicate propagating (green filled circles) and nonpropagating (black open circles) axonal spikes. E, Plot of somatic spike amplitude against ISI. The blue line represents the best-fit separatrix defined by Equation 1, with τ = 2.0 msec, k = 0.056 mV-1, and V1/2 = 18.1 mV. F, Plot of peak dV/dt against ISI. The values for the best-fit separatrix (blue line) are τ = 2.04 msec, k = 0.0097 sec·V-1, and V1/2 = 22.4 V·sec-1.

