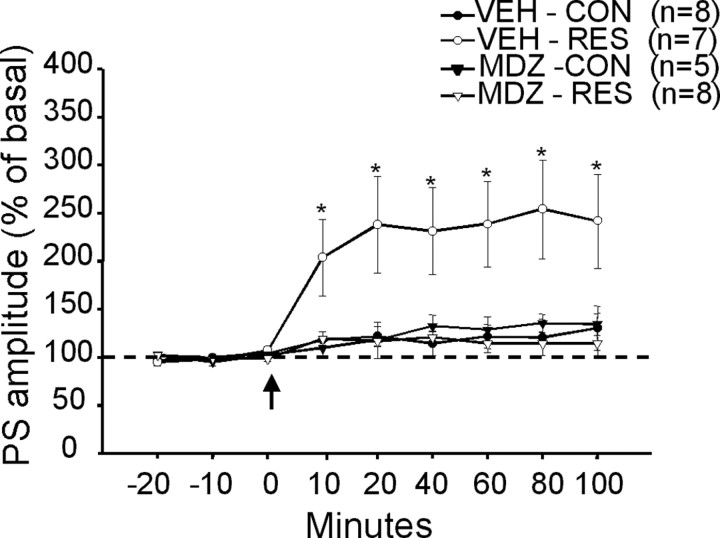
Figure 7.
LTP in the BLA: effect of pretreatment with MDZ. PS amplitude is expressed as the percentage of basal records obtained in the same slice before HFS (arrow). The values are means ± SEM for slices obtained from control and restrained rats pretreated with MDZ or VEH (number of animals in parentheses). *Significantly different from all other records at each time after HFS (p < 0.05 or smaller). Dotted line indicates 100%.

