
Figure 2.
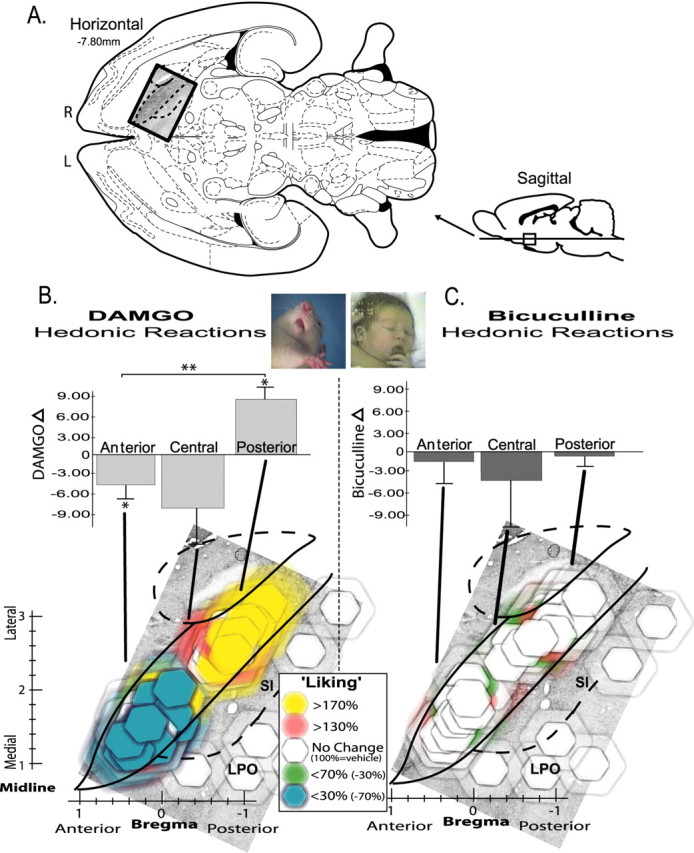
Hedonic “liking” generation maps. Changes in hedonic impact of sucrose caused by VP microinjections of DAMGO versus bicuculline (assessed by taste reactivity; all doses included). A, Location of VP in horizontal and sagittal sections (Paxinos and Watson, 1998). R, Right; L, left. B, Opioid hedonic generation map, DAMGO effects on sucrose “liking.” Horizontal view of VP (superimposed on enkephalin stain) shows changes in positive sucrose-elicited “liking” reactions caused by DAMGO microinjections, expressed as within-subject percentage changes from vehicle microinjections at the same sites (vehicle, 100%). Bilateral VP sites from left and right brains of each rat are collapsed together here into a unilateral single map of VP (right brain) for better simplicity (all doses represented). Colors denote direction and intensity of “liking” change from vehicle levels, and symbol size shows the diameter of intense Fos plumes (10× elevation above normal; 0.28 mm radius for 0.01 μg DAMGO), surrounded by semitransparent halos that show diameter of moderate Fos plumes (0.49 mm radius). Bar graph above shows average intensity of change caused by microinjections in each ⅓ region of VP: anterior, central, or posterior (within-subject difference score of drug minusvehicle; *p < 0.05; **p < 0.01). C, GABAA blockade hedonic generation map. Bicuculline effects on sucrose “liking” (0.2μg bicuculline; otherwise same as B). Photographs show example hedonic “liking” reactions to sucrose by rat and human infant [modified from Steiner et al. (2001)] (also see “liking” examples in supplemental movies, available at www.jneurosci.org as supplemental material). Error bars represent SEM. SI, Substantia innominata; LPO, lateral preoptic area.