Figure 3.

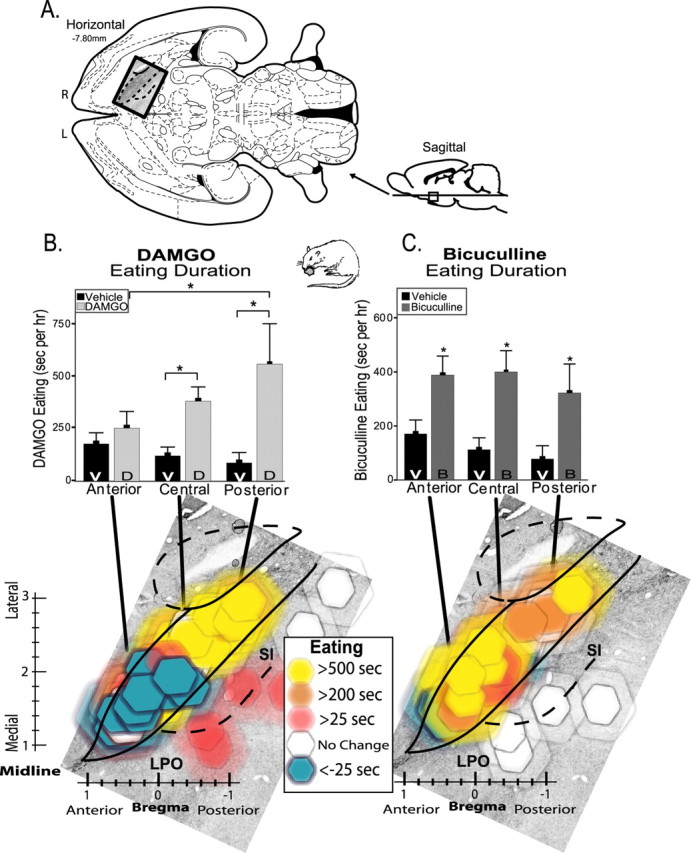
Eating behavior generation maps. Changes in eating duration caused by VP microinjections of DAMGO versus bicuculline. A, Location of VP maps in horizontal and sagittal sections (Paxinos and Watson, 1998) (horizontal section superimposed on enkephalin stain). R, Right; L, left. B, DAMGO (D)-induced changes in duration of eating behavior compared with after vehicle (V) microinjections at same sites. Bar graph shows cumulative average duration of eating behavior after vehicle versus DAMGO microinjection in anterior, central, and posterior regions of VP (*p < 0.05). Bottom color map shows DAMGO-evoked changes in eating behavior duration for each microinjection site (compared with vehicle). Colors represent direction and intensity of change in eating (drug minus vehicle); symbol size represents Fos plume spread (as Fig. 2). Bilateral VP sites from left and right brains of each rat are collapsed together here into a unilateral single map of VP (right brain) for better simplicity (all doses represented). C, Bicuculline (B)-evoked generation of eating behavior. Bar graph and color map otherwise same as B. Error bars represent SEM. SI, Substantia innominata; LPO, lateral preoptic area.
