
Figure 5.
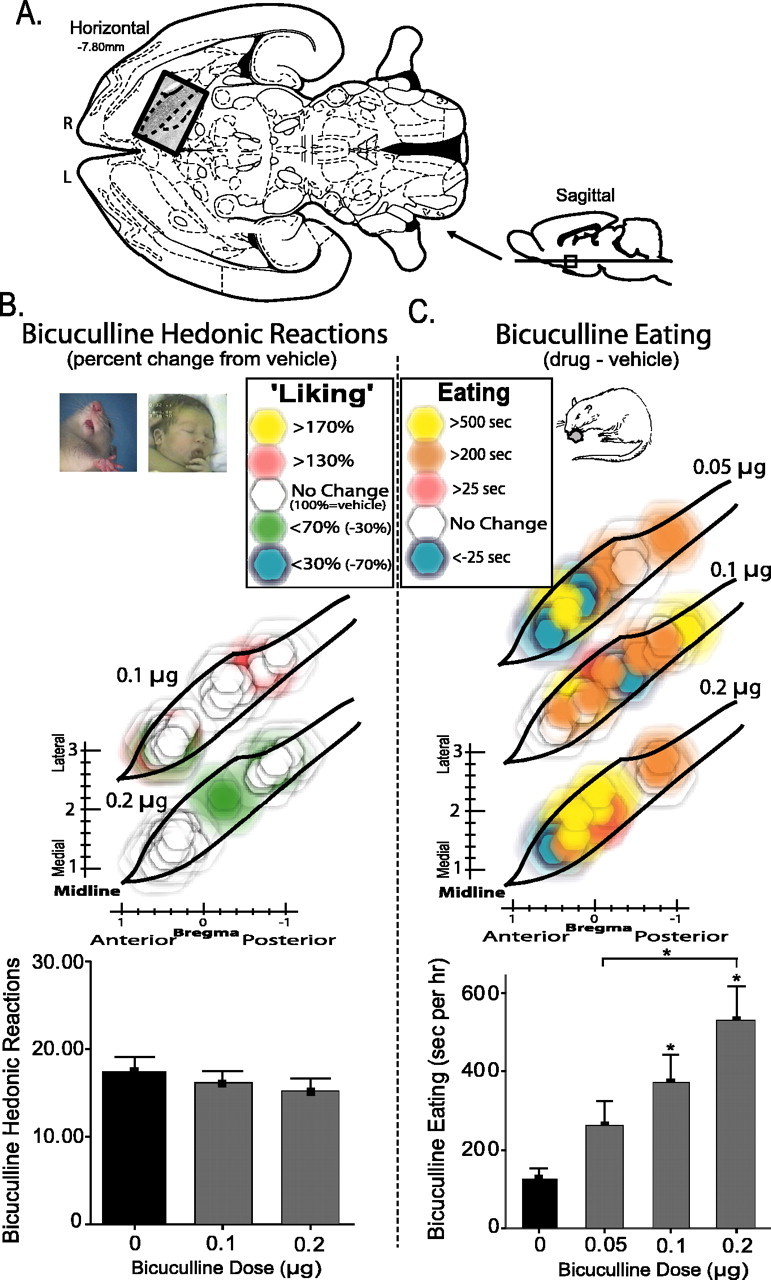
Functional dose–response VP maps of bicuculline effects. A, Location of VP maps in horizontal and sagittal sections (Paxinos and Watson, 1998)(horizontal insert overlaid with enkephalin stain). R, Right; L, left. B, Bicuculline sucrose “liking.” Color function maps show changes in hedonic “liking” reactions elicited by sucrose taste after each dose of bicuculline (0.1, 0.2 μg) compared with vehicle (percentage change from vehicle, 100% at same site). Symbols are as in Figures 2, 3, 4. The bottom bar graph represents total number of positive hedonic “liking” responses to sucrose after bicuculline or vehicle microinjections (no anatomical differences existed for bicuculline eating effects, and so all VP sites were combined). C, Bicuculline-evoked increases in eating behavior. Color maps shows relative increase in eating duration evoked by each dose of bicuculline (0.05, 0.1, 0.2 μg) compared with vehicle at the same site. Bar graph represents cumulative eating durations evoked by vehicle and by each bicuculline dose (*p < 0.05). Error bars represent SEM.