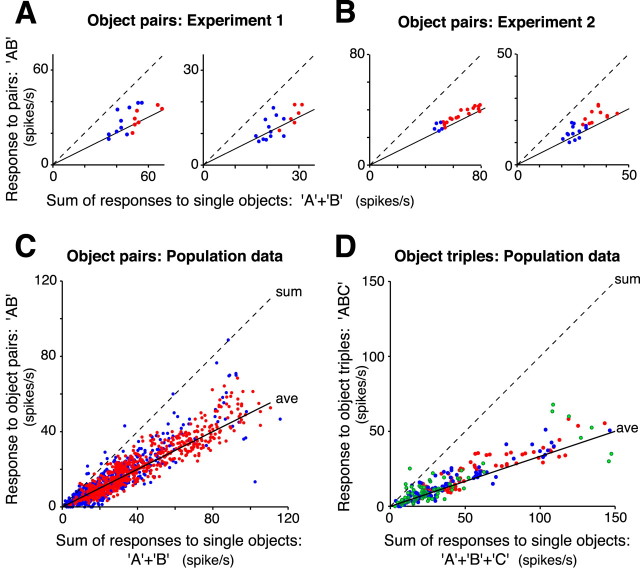
Figure 3.
Responses to multiple objects as a function of the sum of responses to single objects. In each scatter plot, responses to object pairs (A–C) or object triplets (D) are plotted against the sum of the responses to the constituent objects presented alone. The dashed and solid straight lines indicate, respectively, the sum and the average of the responses to single objects. The slope of the solid line is one-half in A–C and one-third in D. A, Example data from two individual neurons recorded in experiment 1. Data in the left panel are from the same neuron shown in Figure 2, A and B. Red and blue dots refer to pairs in which, respectively, both or only one of the objects in the pair produced a response significantly higher than background rate (t test; p < 0.05). B, Examples of scatter plots for two individual neurons recorded in experiment 2. Data in the left panel are from the same neuron shown in Figure 2C–E. Color code as in A. C, Scatter plot including responses to object pairs for the whole population of 79 responsive neurons recorded in the three monkeys. Color code as in A. D, Scatter plot including responses to object triplets for the whole population of 48 responsive neurons recorded in experiment 1. Red, blue, and green dots refer to triplets in which, respectively, three, two, or only one of the constituent stimuli evoked a response significantly higher than background rate. In both the individual examples and the population data, responses to multiple objects are normalized in that they were approximately the average of the responses to the constituent objects presented alone.

