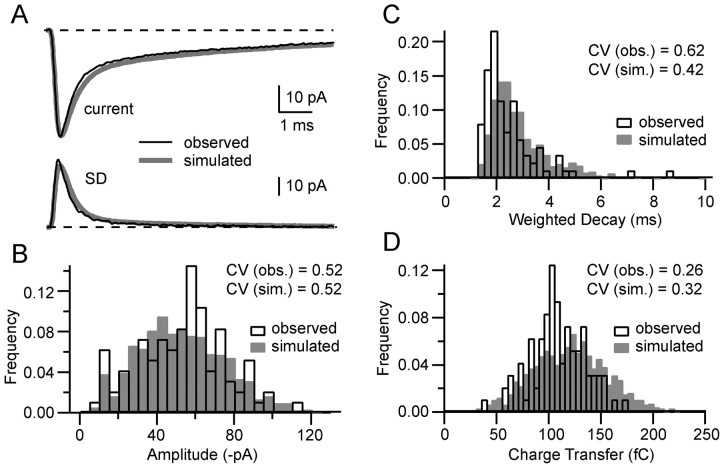
Figure 9.
Simulations closely approximate the trial-to-trial variability in EPSC amplitude and shape. A compares the mean EPSC (top) and SD (bottom) calculated from a sample of 96 EPSCs measured from an MF-GC synaptic connection (black line) and the mean EPSC and SD calculated from a sample of 1000 simulated EPSCs for this connection (gray line). The quantal parameters for this connection, N = 5 and PR = 0.46 at 2 mm [Ca2+], are similar to the population mean. B–D compare real and simulated EPSCs for their peak amplitudes (0.1 ms window; B), weighted decay (C), and charge transfer (D).

