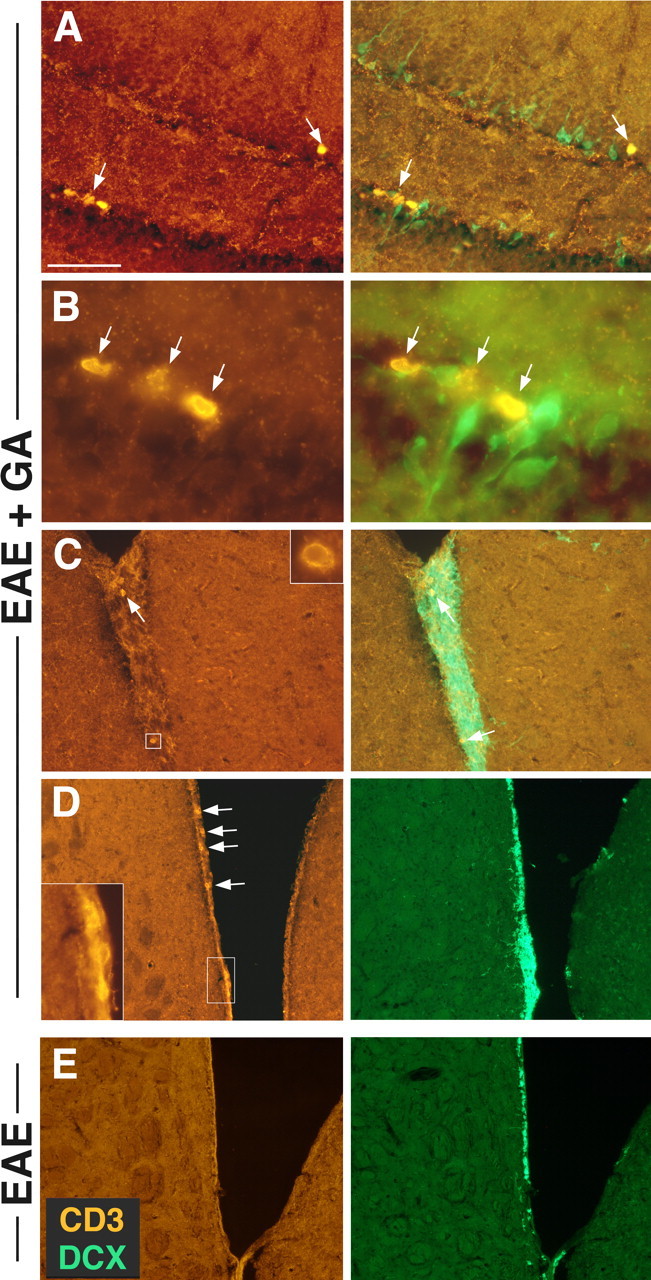
Figure 5.

The association of T-cells with the neuroproliferative response induced by GA. CD3-stained T-cells (red) adjacent to DCX+ progenitor cells (green) in the SGZ of the hippocampus (A, B) and in the SVZ (C, D) of EAE+GA mice. T-cells were not detected in the neuroproliferative zones of EAE-untreated mice as shown in the SVZ (E). EAE was induced in C57BL/6 mice 35 d (A–C) and 55 d (D, E) before perfusion. GA treatment was applied by eight daily injections, starting at day 20 from induction, after the appearance of disease manifestations (suppression) (coronal sections). Scale bar: A, 64μm; B, 12μm; C, 100μm; D, 200μm.
