
Figure 4.
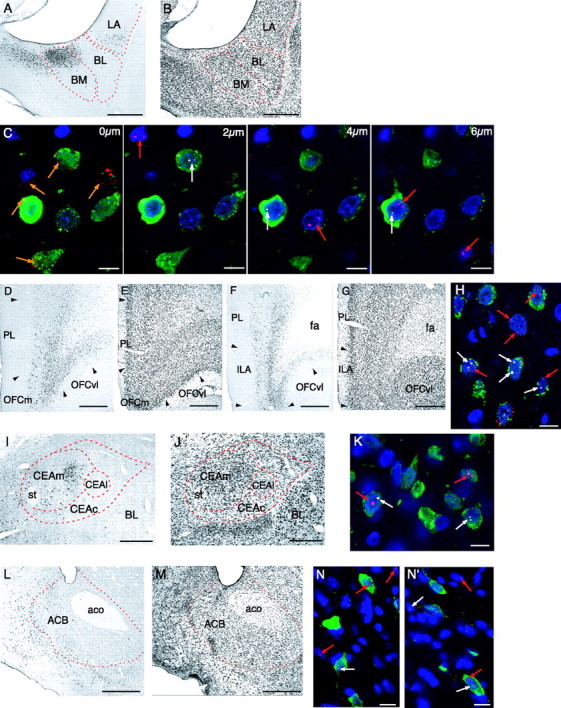
Photomicrographs showing retrogradely labeled neurons (black deposits) within the BL/BM (A, an adjacent thionin-stained section shown in B), rostral and caudal omPFC (D, F, adjacent thionin-stained sections shown in E, G), CEA (I, an adjacent thionin-stained section shown in J), and ACB (L, an adjacent thionin-stained section shown in M) after FG injection in the LHA (shown in Fig. 3). C, High-power photomicrographs of 1-μm-thick optical confocal sections showing a group of neurons in the BM through the z-axis at 0, 2, 4, and 6 μm, after combined FG detection with double-label FISH for Arc and H1a mRNA. FG-labeled neurons are visible in green; nuclei counterstained with DAPI are shown in blue; Arc INF are shown in red (red arrow); H1a INF are shown in white (white arrow). Cytoplasmic Arc mRNA, the appearance of which coincides with H1a INF, is also visible (0 μm; orange arrow). Four types of stained neurons that were analyzed are as follows:nonprojecting neurons (single labeled with the nuclear counterstain DAPI), neurons that project to the LHA (double labeled; FG and DAPI), projecting neurons that are selective to one test [triple labeled; FG, DAPI, and one of the two IEGs (Arc or H1a INF)], and nonselective projecting neurons (quadruple-labeled neurons; FG, Arc INF, H1a INF, and DAPI). Photomicrographs of 1-μm-thick single optical plane confocal images showing the four types of stained neurons in the omPFC (H), CEA (K), and ACB (N and nearby visual field N′) after combined FG detection with double-label FISH for Arc and H1a mRNA. aco, Anterior commissure; CEAc, capsular CEA; CEAl, lateral CEA; CEAm, medial CEA; fa, anterior forceps of corpus callosum; ILA, infralimbic area; PL, prelimbic area; OFC, orbitofrontal cortical area; OFCm, medial area of OFC; OFCvl, ventrolateral area of OFC; st, stria terminalis. Scale bars: A, B, D–G, I, J, L, M, 500 μm; C, H, K, N, N′, 10 μm.