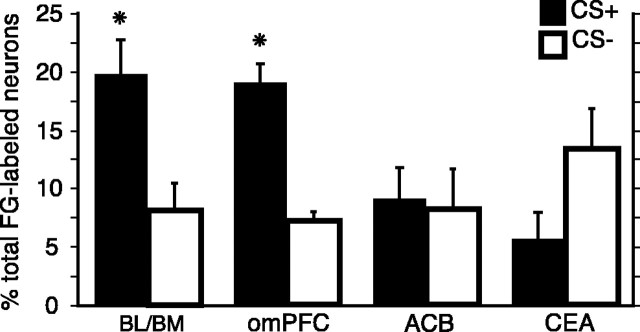
Figure 5.
The percentage of total FG-labeled neurons that were labeled with one of the IEG markers (Arc INF or H1a INF) after food-consumption tests (Fig. 2 B) in the presence of CS+ compared with tests with CS– in the BL/BM, omPFC, ACB, and CEA. The asterisks refer to statistically reliable differences between CS+ and CS– (for details, see Results). Error bars represent SEM.

