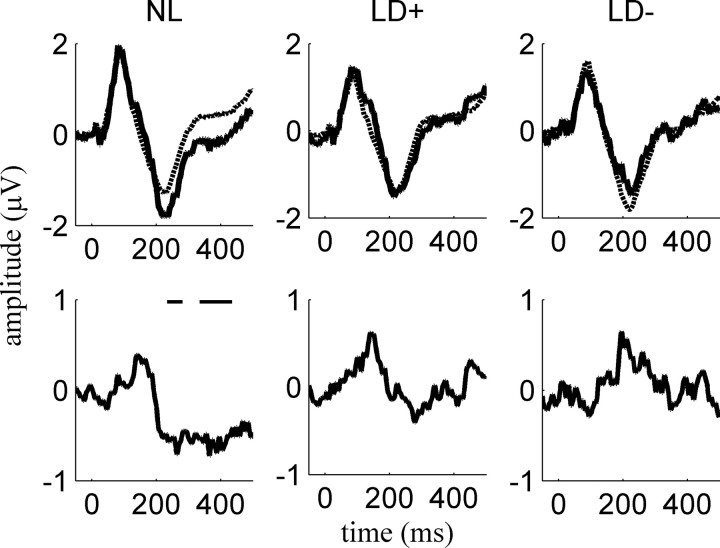
Figure 4.
MMN. Top row, Grand average responses to a rare /da/ presented amid a frequent /ga/ (solid line) versus /da/ presented alone (dashed line). No group differences were found in the responses to /da/ alone. Bottom row, The difference between the response to the rare /da/ and the response to /da/ presented alone. The black horizontal line indicates periods of significant MMN. Data shown are from Fz. The same pattern was seen at Cz.

