
Figure 4.
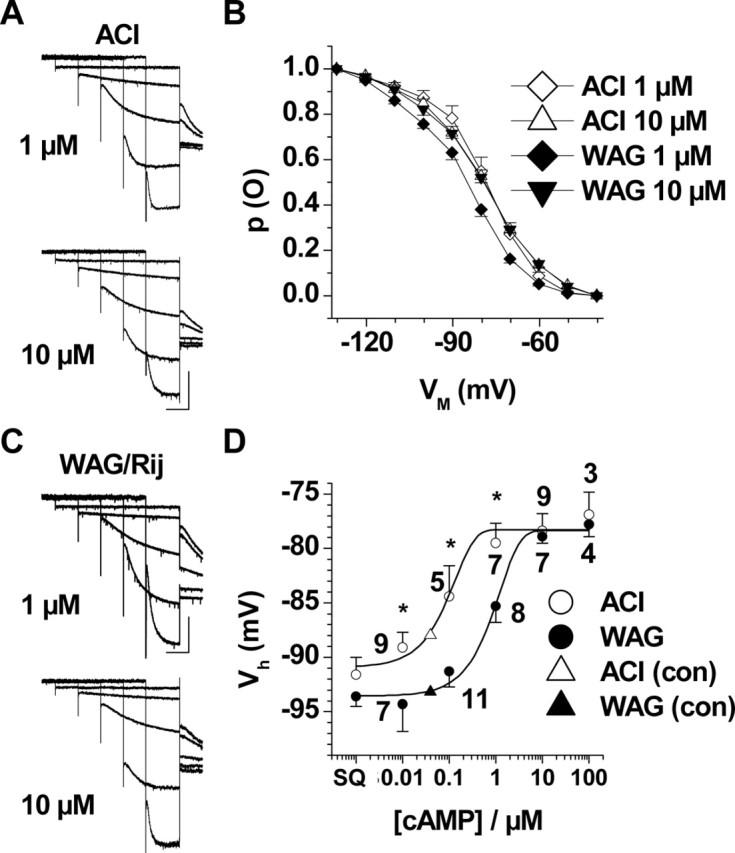
Modulation of Ih by defined intracellular cAMP concentrations. A, C, Families of current traces recorded in TC neurons of ACI (A) and WAG/Rij (C) rats obtained after loading of the cells with 1 μm (top) and 10 μm (bottom) 8-bromo-cAMP. Current traces at -50, -70, -90, -110, and -130 mV are shown. Calibration bars: 1 s, 300 pA. B, Mean steady-state activation curves of Ih at different intracellular cAMP concentrations in TC neurons from ACI (1 μm cAMP, open diamonds, n = 5; 10 μm cAMP, open triangles, n = 9) and WAG/Rij (1 μm, filled diamonds, n = 11; 10 μm, filled triangles, n = 7). D, Dose-response curve of cAMP applied via the intracellular solution. The mean half-maximal activation of Ih is plotted against the cAMP concentration for TC neurons from ACI (open circles) and WAG/Rij (filled circles). The numbers near the symbols indicate number of recorded cells; differences between epileptic and nonepileptic strains are significant (*p < 4.7 × 10⁻²) at 0.01, 0.1, and 1 μm cAMP. The triangles indicate endogenous cAMP levels in TC neurons of ACI (open triangle) and WAG/Rij (filled triangle), as extrapolated from the values of half-maximal Ih activation with no addition of cAMP to the recording pipette (see Fig. 2 B). WAG, WAG/Rij; con, control. Error bars represent SEM.