
Figure 7.
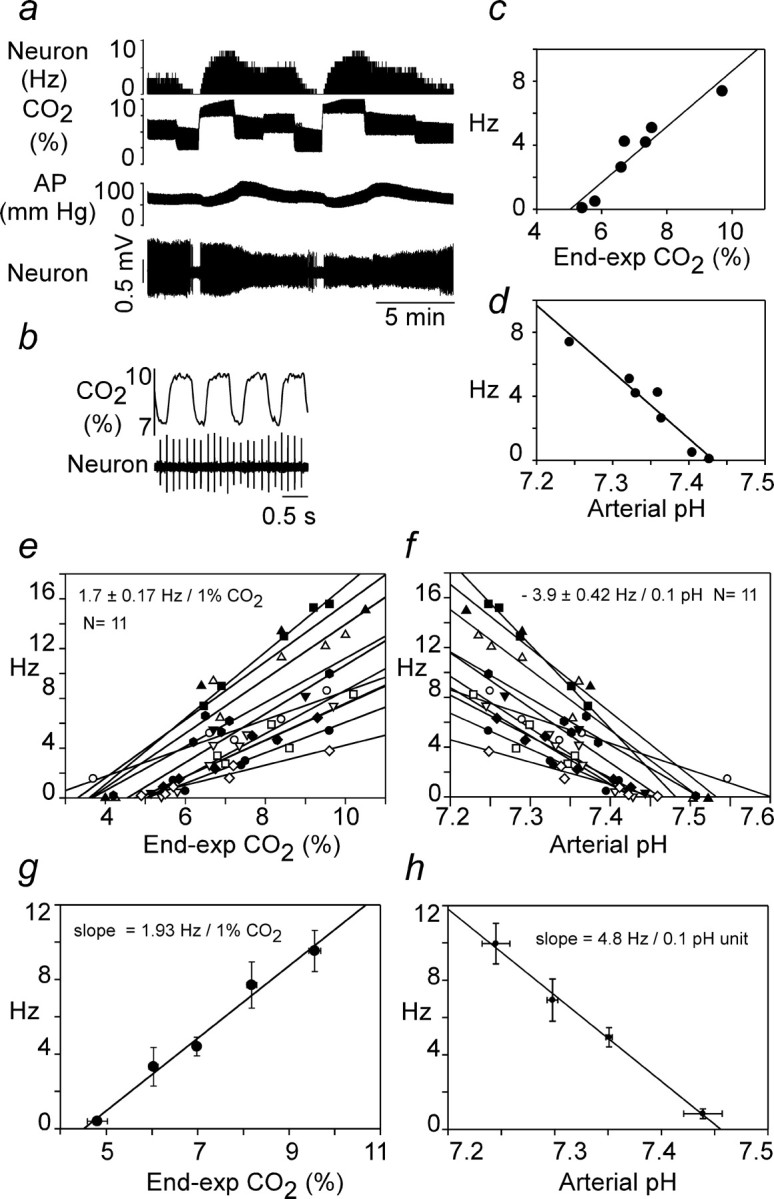
Response of RTN neurons to hypercapnia at steady state in rats treated with kynurenic acid. a, Example of original recording traces. Arterial pressure (AP) is low attributable to central sympatholytic action of KYN. b, Same cell at expanded time scale to illustrate regularity of discharges. c, Plot of discharge rate of the cell versus end-expiratory CO2 at steady state. d, Replot of the same data after conversion of end-expiratory CO2 values into pHa values using the relationship shown in Figure 1c. e, Relationship between discharge rate and e-exp CO2 for the 11 cells recorded. Individual regression lines are shown, and the number shown above the plots represent the mean ± SE of their individually determined slopes. f, Relationship between discharge rate and calculated pHa for the 11 cells recorded. Individual regression lines are shown, and the number shown above the plots represent the mean ± SE of the individually determined slopes. g, Relationship between discharge rate and e-exp CO2 for the 11 cells. The data were analyzed as in Figure 3a–c, i.e., individual points from all cells (data from e) were regrouped into five bins according to the CO2 level at which each determination was made (<5.5, 5–5-6.5, 6.5–7.5, 7.5–8.5, >8.5%), and the values were averaged within these bins (mean ± SE for both axis shown). h, Relationship between discharge rate and pHa. The data were processed as in g except that only four bins were used (pH <7.275, 7.275–7.325, 7.325–375, >7.375). In g and h, the slope of the regression line through the four or five resulting data points is shown.