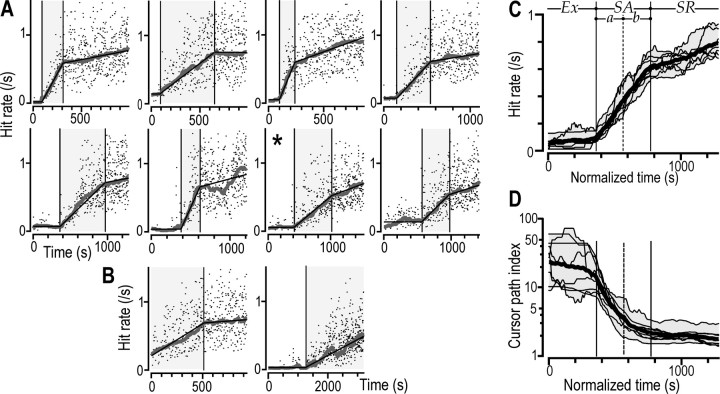
Figure 2.
Learning of the novel visuomotor task as reflected by an increasing hit rate and decreasing cursor path index. A, The hit rate as a function of time for one practice session by each of the eight subjects that displayed three learning stages. Data points indicate, for each target hit, the instantaneous hit rate. The thick gray curve shows the hit rate filtered with a moving median of ±100 s. The superimposed thin black lines shows the piecewise linear function fitted to the hit rate curves to distinguish transitions between learning stages. The shaded area represents the skill acquisition stage. B, Examples of sessions with only two learning stages (same format as in A). C, Superimposed thin lines show the filtered hit-rate curves on a normalized time base for the same eight subjects shown in A. The thick curve represents the mean values of these subject curves, and the shaded zone provides the range. Ex, Exploratory stage; SAa, first half of the skill acquisition stage; SAb, second half of the skill acquisition stage; SR, skill refinement stage. D, Filtered cursor path index for individual subjects shown as a function of normalized time using the same format as in C. Note the logarithmic scale of the ordinate.

