
Figure 7.
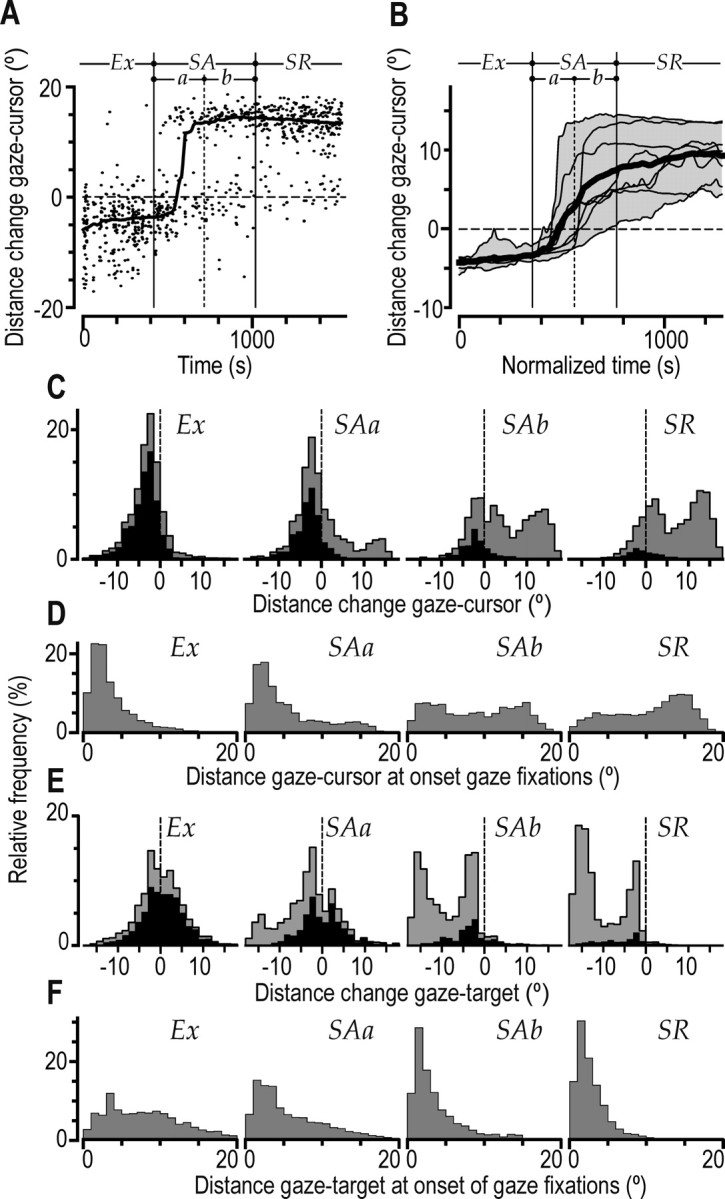
Distance between gaze fixations and cursor and target positions and changes in these distances during a saccade. A, Data points indicate, for a single subject (Fig. 2 A, asterisk), the change in distance between cursor and gaze during each saccade plotted as a function of practice time (negative distance implies that gaze shifted toward the cursor). The curve shows the same data filtered with a moving median of ±100 s. B, Corresponding filtered curves obtained for the same eight subjects shown in Figure 2 A (same format as in Fig. 2C). C–F, Frequency distributions including data from all saccades or submovements obtained from all subjects showing gaze–cursor distance changes during saccades (C), distance between gaze and cursor at the onset of gaze fixations (D), gaze–target distance changes during saccades (negative distance implies that gaze shifted toward the target) (E), and distance between gaze and target at the onset of gaze fixations (F). Learning stages are represented as in Figure 5C. The black areas of the histograms in C and E refer to postsaccadic fixations that lagged the position of the cursor (Fig. 5, negative times). Exploratory stage; SAa, first half of the skill acquisition stage; SAb, second half of the skill acquisition stage; SR, skill refinement stage.