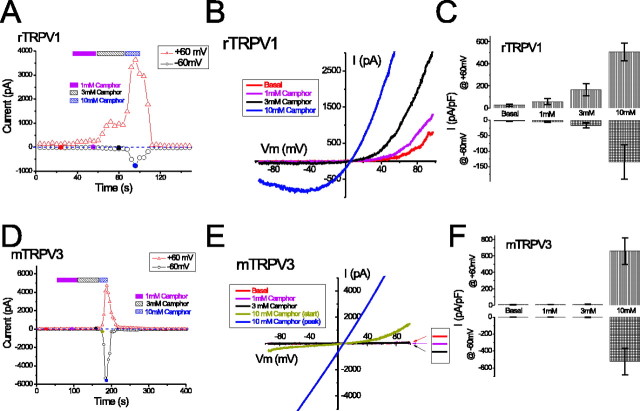
Figure 2.
Camphor activates TRPV1 at lower concentrations than TRPV3. A, Concentration dependence of the activation of TRPV1 by camphor (1, 3, and 10 mm). Representative ramp currents shown in B correspond to the filled circles with the same color in A. Note the negative slope in the inward current during the ramp, characteristic of ITRPV1. C, Average TRPV1 current densities (current amplitude normalized to the capacitance of each cell; pF) elicited by 1–10 mm camphor. Data are shown as mean ± SEM. D–F, Concentration dependence of the activation of TRPV3 by 1–10 mm camphor. The representative ramp currents are shown in E. Note the change of rectification during the development of ITRPV3 after camphor application, as the peak current became linear. F, Average ITRPV3 density induced by different concentrations of camphor.

