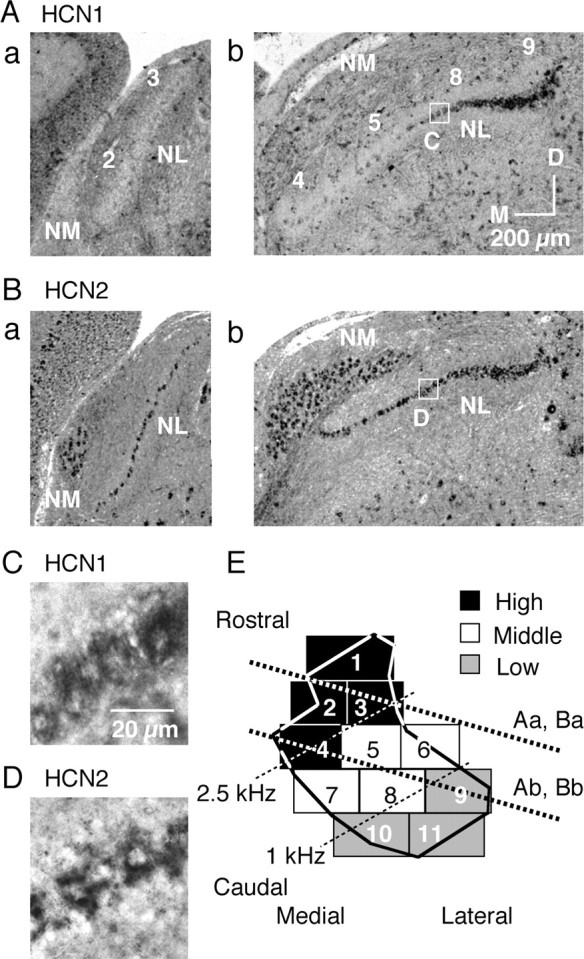
Figure 1.

Reduced expression of HCN1 mRNA in the high CF region. A, B, Expression patterns of HCN1 mRNA (A) and HCN2 mRNA (B), detected by in situ hybridization. Orientation of these subcoronal slices is indicated in E by thick dotted lines. Numbers on each slice (Aa, Ab) correspond to sectors indicated in E. M, Medial; D, dorsal. C, D, High magnification of boxes in Ab and Bb, HCN1 mRNA (C) and HCN2 mRNA (D). E, Two-dimensional projection of NL (Rubel and Parks, 1975; Kuba et al., 2005). Eleven sectors were defined depending on their rostromedial and caudolateral position within NL and were classified into three CF regions: high (black sectors, 2.5–3.3 kHz), middle (white sectors, 1–2.5 kHz), and low (gray sectors, 0.4–1 kHz).
