Figure 2.
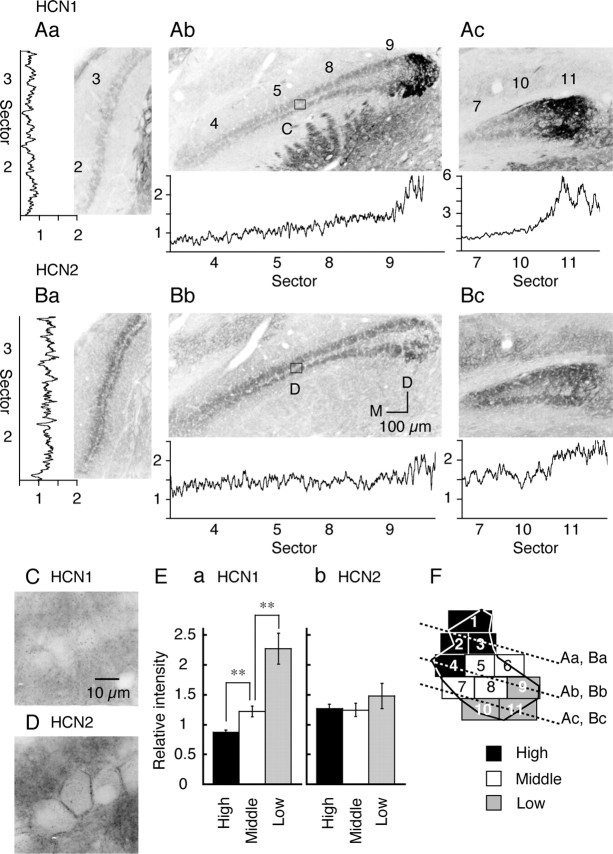
Graded expression of HCN1 channels along tonotopic axis. A, B, Subcoronal slices stained with HCN1 (A) and HCN2 (B) antibodies. Orientation of these subcoronal slices is indicated in F by dotted lines. The traces beside each panel are the relative intensity profiles of immunoreactivity in each slice (see Materials and Methods). Numbers on the abscissa indicate the sectors. M, Medial; D, dorsal. C, D, The high magnification of boxes in Ab and Bb. E, The relative immunoreactivity was measured in the neuropil and averaged for three CF regions (6 chicks). Statistical significance is indicated by **p < 0.01 in this and the following figures. F, The relationship of slices to the tonotopic region of the nucleus (see Fig. 1 E).

