Figure 3.
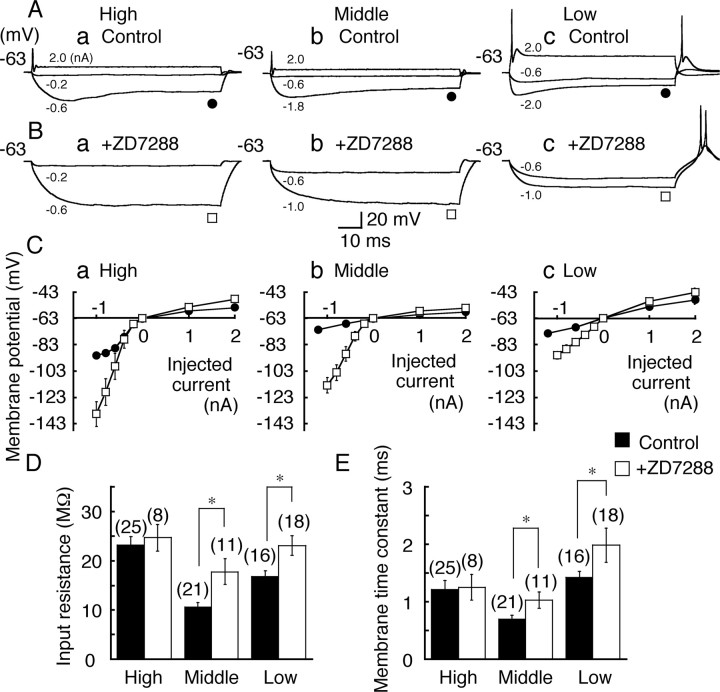
Membrane properties in three CF neurons. A, B, Voltage responses to depolarizing and hyperpolarizing currents of 70–80 ms duration in the control (A) and after bath application of ZD7288 (0.1 mm)(B). For A–C, a, High CF neurons; b, middle CF neurons; c, low CF neurons. The injected currents are indicated in each trace. Holding potential is indicated to the left in this and the following figures. C, Voltage and current relationship measured at the end of current injection of –1.2 to 2 nA in the control (filled circles) and after application of ZD7288 (open squares) was plotted against the injected current (mean ± SE; SE was small and was masked by symbols in the control). D, E, Input resistance (D) and membrane time constant (E). Filled bars, Control; open bars, in the presence of ZD7288. Numbers in parentheses are the numbers of cells in this and subsequent figures. After application of ZD7288, input resistance and membrane time constant increased significantly in the middle CF and the low CF neurons but not in the high CF neurons. Statistical significance is indicated by *p < 0.05 in this and the following figures.

