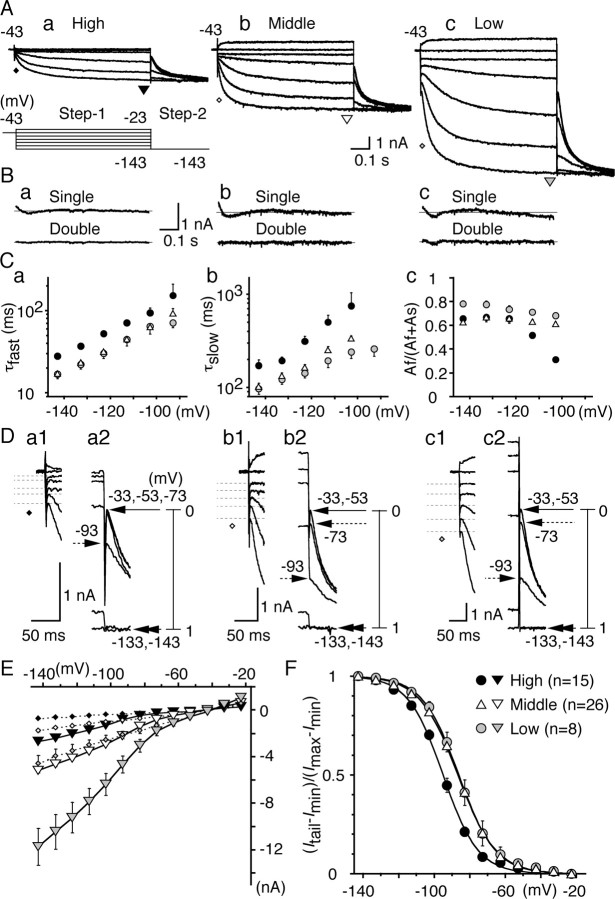
Figure 5.
Comparison of Ih among three CF neurons. A, Represent ative current traces. For A, B, and D, a, High CF neurons; b, middle CF neurons; c, low CF neurons. The pulse protocol is indicated at the bottom of Aa. The same pulse protocol was used in subsequent voltage-clamp experiments (Figs. 6, 7). The initial current and the steady-state current were measured at the times indicated by diamonds (see also D) and triangles. B, Difference between the data and the curve fits for the single (top) and double (bottom) exponential functions (see Results). The double-exponential fit gave much better results than the single-exponential fit. C, Fast (a) and slow (b) time constants of current activation and the fraction of fast component (c) were plotted against step 1 potential. For C, E, and F, Black symbols, High CF neurons; white symbols, middle CF neurons; gray symbols, low CF neurons. D, The expanded traces after step1 (a1, b1, c1) and step2 (a2, b2, c2). Amplitude of initial current was measured at the peak, indicated by dashed lines (a1, b1, c1), and averaged value was plotted in E (diamonds). Tail current amplitude (Itail–Imin) was scaled between 0 and 1 and was plotted against the step 1 potential in F. Step 1 potentials are indicated at corresponding tail currents. E, I–V relationships of both in itial (diamonds) and steady-state (inverted triangles) current measured at the times indicated in A and D. SEs were small and were masked by the symbols in the high CF and the middle CF neurons. F, Voltage dependence of activation measured from the tail current. Solid lines are the Boltzmann fits to the average data. Vh and S (see Results) were measured in each experiment and averaged (Table 1). Note that the voltage dependence was 10mV more positive in the middle CF and low CF neurons than that in the high CF neurons (p < 0.01).

