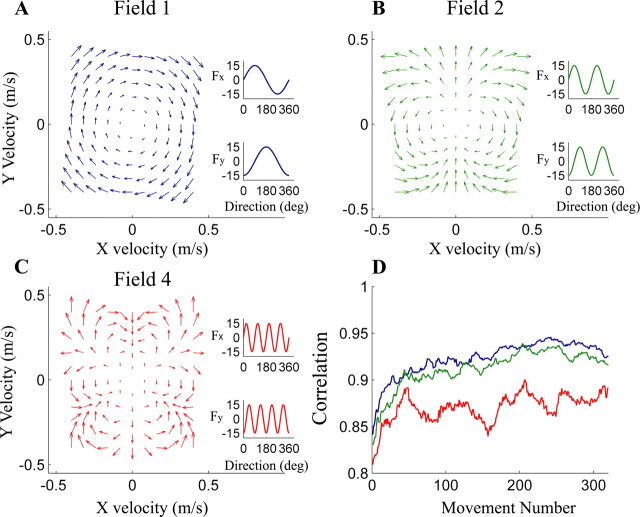
Figure 1.
Mean subject performance (D) in fields 1 (A; blue), 2 (B; green), and 4 (C; red). The numbers of the fields identify their spatial frequency (Eq. 1). The magnitude and direction of the applied force (arrows) depend on the x- and y-components of hand velocity, represented on the x- and y-axes, respectively. Insets show the dependence of x- and y-components of force on velocity direction. D, Correlation coefficients plotted against movement number as subjects train in fields 1 (blue), 2 (green), and 4 (red). Correlation coefficients were smoothed using a 20-movement moving average.

