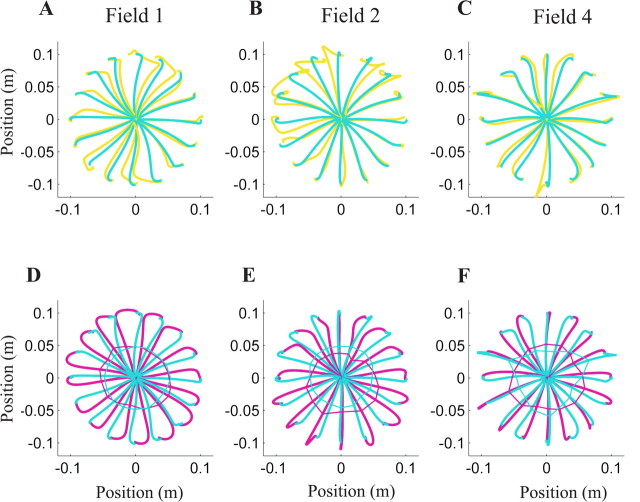
Figure 2.
Mean subject hand trajectories during fielded movements (A–C) and catch trials (D–F) in fields 1 (A, D), 2 (B, E), and 4 (C, F). Axes represent x and y hand positions. A–C, The gold lines represent the first movement in the force field, and the blue lines represent a movement immediately before a catch trial. D–F, Catch-trial trajectories are plotted in magenta with the replotted, blue precatch-trial trajectories. The vertices of the polygons connect positions at peak velocity. Magenta vertices outside blue vertices indicate that subjects anticipated a resistive force; blue outside magenta indicates anticipation of an assistive force.

