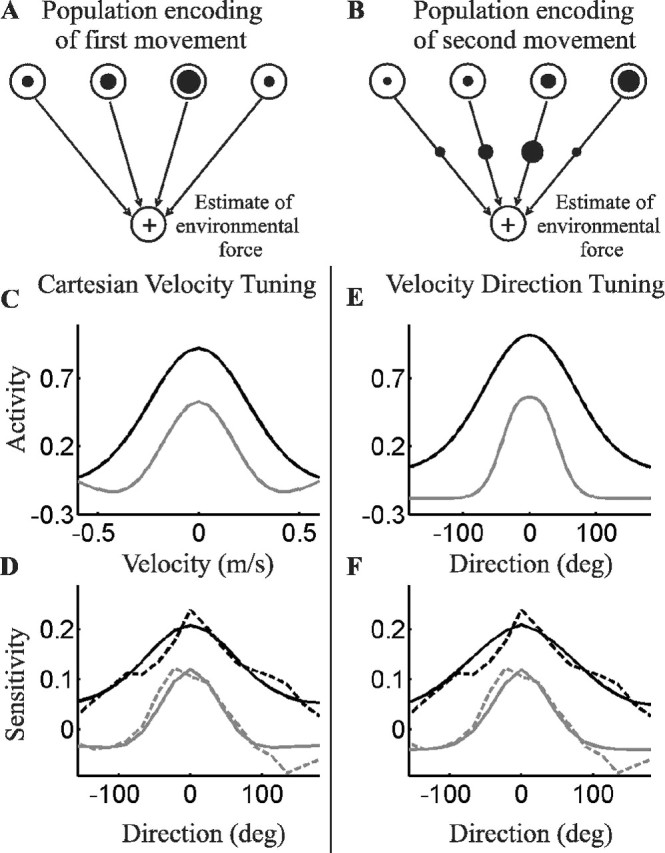
Figure 4.

Neural network model (A, B) and model neuron tuning (C, E) that mimicked (D, F) movement-by-movement generalization in fields 1 and 2. A, Upper-level neurons, encoding desired movement space, projected to lower-level neurons, encoding predicted force (Eq. 3). The radii of the circles within the upper-level neurons represent activity in one movement. B, After this movement, the error-induced weight change (Eq. 4) is represented by the circles on the interlayer connections. A second movement then activated different portions of the upper neuronal tuning curves, as represented by new circles. C, Individual neuronal tuning functions, encoding Cartesian velocity, that best fit subject movement-by-movement sensitivity in fields 1 (black) and 2 (gray). The tuning was symmetrically dependent on the x- and y-components of hand velocity (only one dimension is shown). D, Simulations of sensitivity functions, as determined by the neuronal tunings in C and calculated using Equation 6. The dashed lines replot the human sensitivities from Figure 3. E, F, Best-fitting individual tuning functions (E) and simulated sensitivity functions (F) with neurons that encode velocity direction and scale activity with movement speed.
