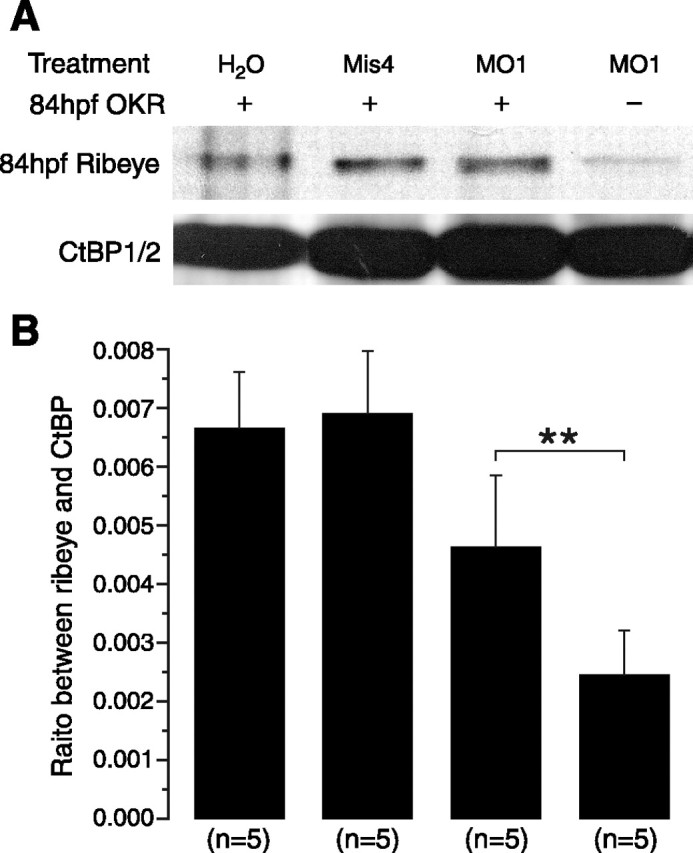
Figure 4.

MO suppresses Ribeye a expression. Western blot analysis of Ribeye a levels. A, MO-injected embryos contained markedly decreased Ribeye a compared with those injected with H2O or Mis4. However, in MO-injected embryos that were OKR positive, Ribeye a levels were not significantly decreased. B, Bar graph representing quantitative analysis of Western data. Ribeye a was reduced by >60% in MO-injected, OKR-negative embryos. In contrast, it was decreased only ∼30% in MO-injected, OKR-positive embryos. **p < 0.01.
