Figure 1.
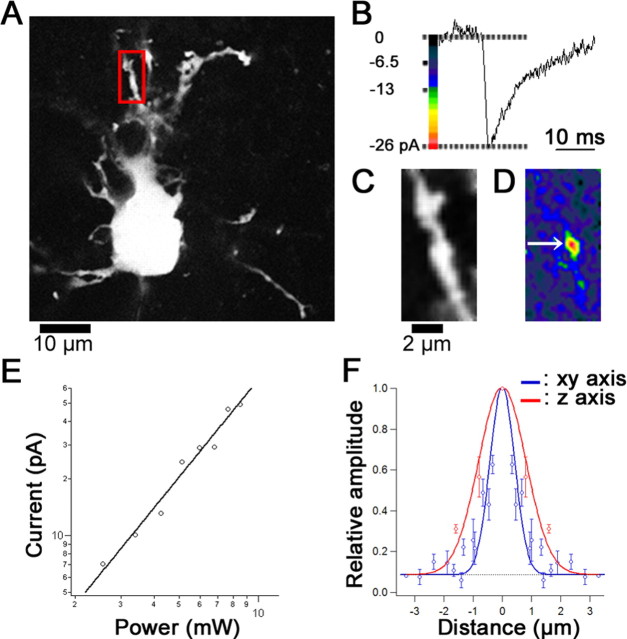
Hot spot of glutamate sensitivity and spatial resolution of two-photon uncaging. A, Fluorescence (calcein) image of a recorded PC in the P3 rat cerebellum. A red frame indicates a region of interest (ROI) for glutamate sensitivity mapping shown in C and D. B, Representative trace of 2pEPSCs obtained during repetitive photolysis (6.8 mW, 1 ms/pixel). C, A magnified fluorescence image in the ROI. D, A glutamate sensitivity map of the 2pEPSC amplitudes represented by pseudocolor coding. E, Double-logarithmic plot of the dependence of 2pEPSC amplitudes on the incident power. No current was evoked by light alone (data not shown). F, Relative amplitude of 2pEPSCs evoked by irradiation for 2 ms at 6.8 mW along the xy (blue) and z (red) axes. Amplitudes of 2pEPSCs were normalized by the amplitude evoked at the center of the hot spot. The smooth lines represent Gaussian curves fitted to experimental data, and the fitted curves were constrained to 1.5 times the SD of baseline variance (-3 pA). The FWHM is 1.2 μm on the horizontal axis and 2.3 μm on the vertical axis. The dotted line represents the threshold of detection (-3 pA). Error bars represent SEM.

