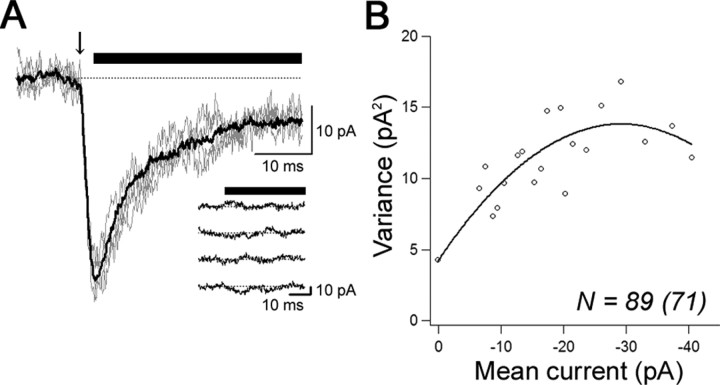
Figure 2.
Estimation of properties of AMPA receptors in a single synapse. A, Superimposed representative four 2pEPSCs traces (gray) and an averaged trace (black) analyzed with NSFA at the hot spot shown in Figure 1. The arrow indicates a timing of photolysis (6.8 mW, 2 ms), and the horizontal bars indicate the time window used for NSFA. Inset, Representative currents after subtraction of the average current. B, Variance of 2pEPSCs plotted versus the mean amplitudes. Data were fitted by parabolic theoretical functions (see Materials and Methods). Raw variance points were binned at 1 pA.

