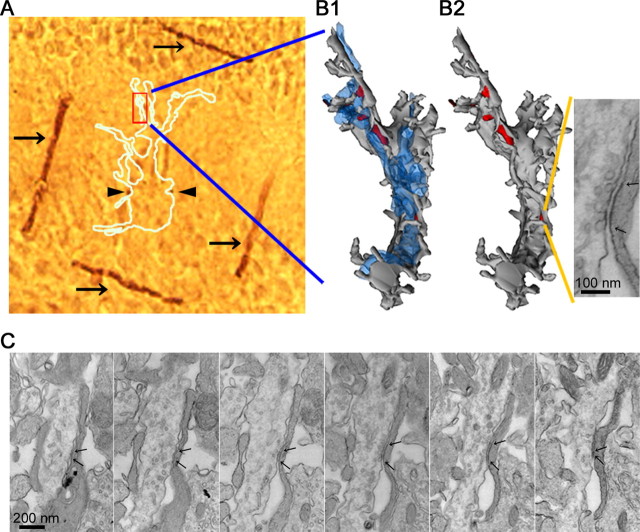
Figure 3.
Identification and measurement of the postsynaptic area of synapses analyzed by NSFA. A, The image of embedded fixed slices with marking by 2p photoconversion. Dark brown lines (arrows) and dots (arrowheads) are oxidized end products of DAB. The white outline indicates the recorded cell. B, Three-dimensional reconstruction of the mapped dendrite. Shown at left and right is the dendrite (gray) with and without CFs (blue), respectively. Red areas are synaptic areas. The synapse stimulated by uncaged glutamate is shown in the inset. C, Serial electron micrographs of the synapse corresponding to the hot spot shown in Figure 1. Arrows indicate the edges of the synaptic sites.

