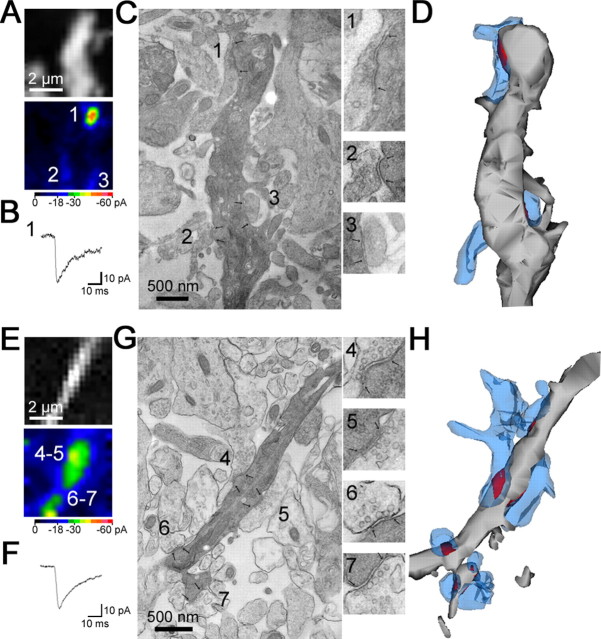
Figure 4.
Measurement of distance from neighboring synapses. In some cases, each visually distinguishable hot spot corresponded to a morphologically defined single synapse distant from neighboring synapses (synapse 1 in A--D). In other cases, however, an apparent single hot spot corresponded to multiple synapses close (<2.3 μm) to each other. Some of them were not visible as hot spots (E-H). The fluorescence image and pseudocolor map of peak amplitudes of 2pEPSCs are shown in A and E. B, F, Current traces at hot spots 1 and 4. C, G, The recorded synapses shown in A and E were identified and photographed under an electron microscope. The numbered hot spots in A and E correspond to the numbered synapses in C and G. Inset, Electron micrographs of the synapses with higher magnification. Synaptic sites are demarcated by arrows. D, H, Three-dimensional images of the dendrites (gray) shown with presynaptic terminals (blue) and synaptic areas (red).

