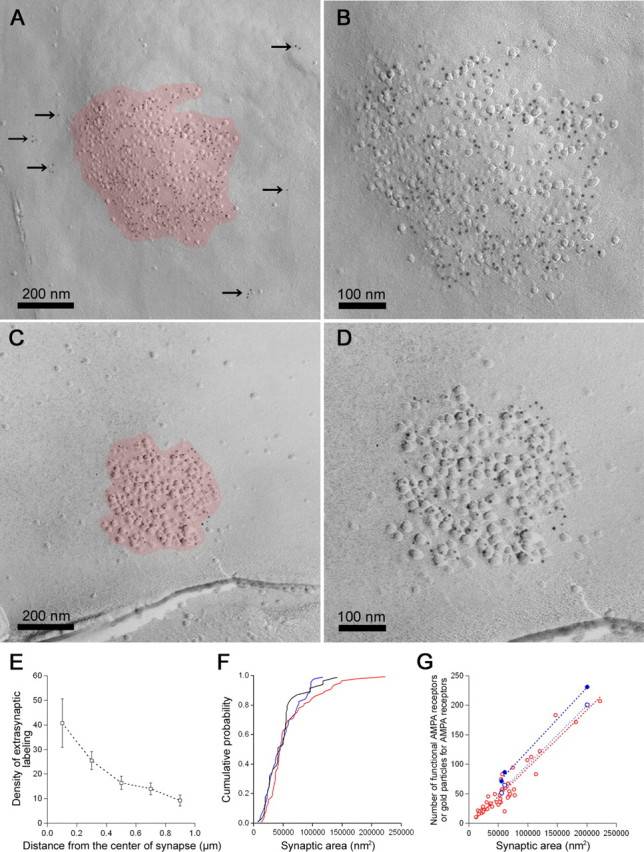
Figure 6.

The number of functional AMPA receptors and immunogold particles for AMPARs are scaled to the synaptic areas. A-D, Representative electron micrographs of IMP clusters (red) with immunogold particles (5 nm) for AMPA receptors. The arrows indicate immunogold particles for extrasynaptic AMPA receptors. B, D, Higher-magnification electron micrographs of the IMP clusters shown in A and C. E, The density of immunogold particles for AMPA receptor gradually decreases as distance from the center of IMP clusters increases (square). Error bars represent SEM. F, The cumulative probability plots of synaptic areas obtained from reconstructed synapses in immersion-fixed slices (blue), IMP clusters in unfixed slices (red), and perfusion-fixed animals (black). G, Linear relationship was observed between the number of functional AMPA receptors and synaptic areas (blue filled circle; r = 0.999) and between the number of immunogold particles and IMP cluster areas (red open circle; r = 0.942; slope of regression line, 977.9 particles/μm2; n = 44). The corrected density of functional AMPA receptors in single synapses for extrasynaptic AMPA receptors according to individual synaptic areas is very homogeneous (990 ± 40 receptors/μm2; n = 3; CV, 0.07; blue open circle). Note that the number of immunogold particles for extrasynaptic AMPA receptors is variable among synapses despite the homogeneous labeling density for synaptic AMPA receptors (A-D).
