
Figure 1.
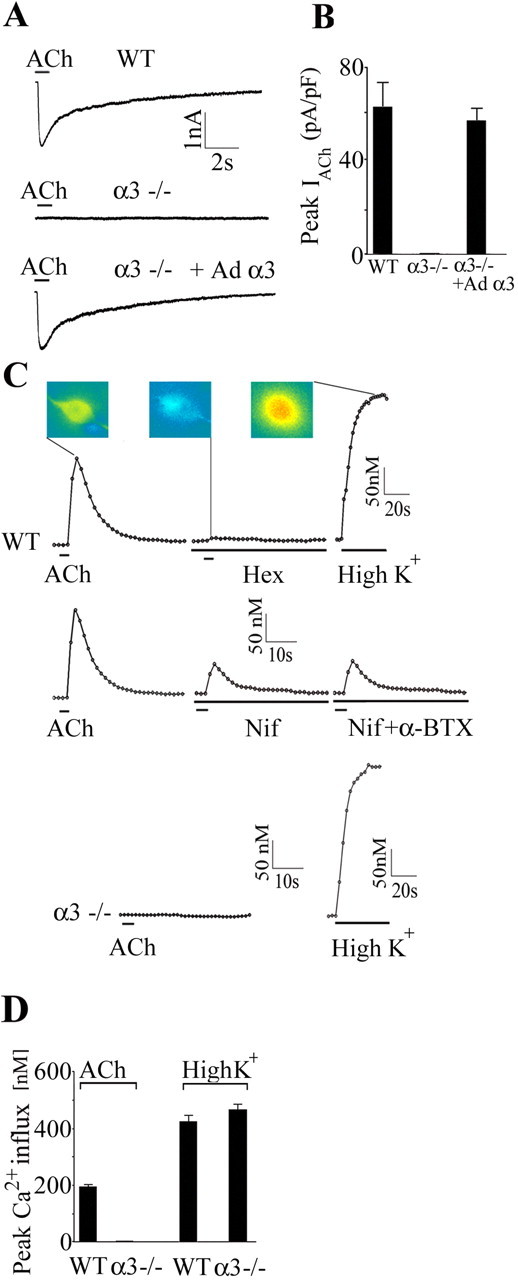
Sympathetic neurons in α3–/– SCG lack ACh-evoked currents and nAChR-induced changes in intracellular calcium. A, Whole-cell recordings from P7 WT SCG neuron in culture for 2 d (top), P8 α3–/– SCG neuron in culture for 2 d (middle), and P8 α3–/– neuron in culture for 5 d and infected with Ad α3 at day 2 in culture (bottom). A brief application of ACh (100 μm) produced a large, rapid inward current on the WT SCG neuron and on the α3–/– neuron infected with Ad α3 but produced no detectable inward current from the α3–/– SCG neuron. B, Mean ACh-evoked current densities on the three types of neurons shown in A. Each column represents the mean ± SEM; n = 25–27. None of the 25 neurons from α3–/– ganglia had detectable ACh-evoked inward currents; however, infecting α3–/– neurons with α3 cDNA restores ACh-evoked current densities to WT levels. C, P6 WT and α3–/– neurons in culture for 1 d were loaded with fura-2 AM and imaged with 340 and 380 nm excitation. The 340/380 ratios were converted to intracellular Ca2+ concentrations and plotted over time. A brief application of ACh (100 μm) produced a large, rapid increase in intracellular Ca2+ concentration in the WT SCG neuron, which was reversibly blocked by hexamethonium (100 μm). The middle three traces in C show that a large fraction of the ACh-induced increase in intracellular Ca2+ was blocked by nifedipine (Nif) (5 μm) and unaffected by αBgt (0.5–1 μm). The bottom two traces in C show that ACh (100μm) produced no detectable change in intracellular Ca2+ concentration in the α3–/– SCG neuron. Depolarizing neurons with 40 mm K+ produced large increases in intracellular Ca2+ in WT and α3–/– neurons. The 340 and 380 images were obtained at 1 s intervals during ACh applications and 5 s intervals during high K+ at 37°C. The inset shows the actual 340/380 images from a WT neuron at the peak of the ACh response, in the presence of hexamethonium (Hex), and at the peak of the high K+ response. D, Mean change in calcium influx induced by ACh (100 μm) and high K+ (40 mm) for WT and α3–/– neurons. ACh did not induce detectable changes in intracellular Ca2+ in α3–/– neurons; however, all α3–/– neurons responded to high K+. The values are the mean ± SEM; n = 32–47.