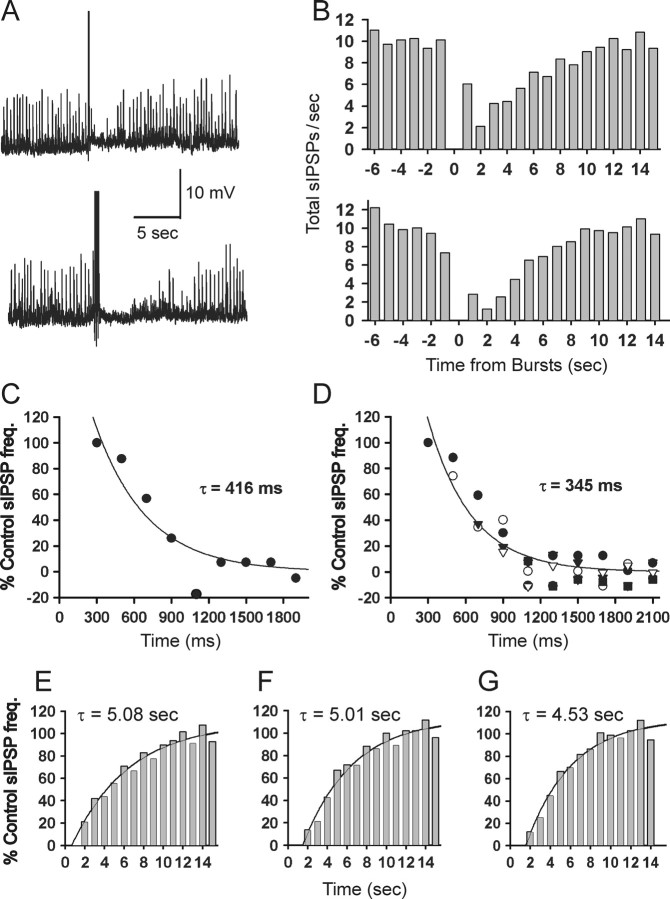
Figure 3.
Dynamics of DSI in adult acute slices. A, DSI of sIPSPs induced by theta burst patterns of action potentials. Raw traces from a CA1 pyramidal cell recorded with a sharp microelectrode filled with 3 m KCl (see Materials and Methods); sIPSPs appear as upward deflections of 2-10 mV. In the top trace, a single theta burst train (5 action potentials, each induced by 5-ms-long DC pulse injected through the recording electrode) occurred at the point of the large upward deflection; in the bottom trace, three theta burst trains (200 ms interburst intervals) were used. The temporary reduction in sIPSPs occurring after each theta train is DSI. B, Analysis of several trials of sIPSPs as in corresponding rows of A (top panel, 1 theta burst; bottom panel, 3 theta bursts). Shown are total sIPSPs over all trials binned in 1 s intervals as described in Materials and Methods. The onset of theta burst trains occurred at time 0. C, Onset of sIPSP suppression. Shown are total sIPSPs occurring immediately after a single theta train which occurred at time 0, rebinned in 200 ms bins (same experiment shown in top part of B). In the first bin (ending at 300 ms), there was no suppression of sIPSPs, and thereafter, the development of DSI is well fit by a single exponential with a time constant of 416 ms. Note in this and other similar figures that the y-axis represents the percentage of the control sIPSP/C frequency (see Materials and Methods); hence negative values do not imply negative frequencies. D, Combined data from experiments (n = 10 cells) in which from one to five theta trains were given (each symbol represents data obtained after a different number of trains). The best-fitting exponential through the combined data are similar to the fit in C. E-G, Recovery from DSI has a similar time course after either one (E), three (F), or five (G) theta trains.

