Figure 2.
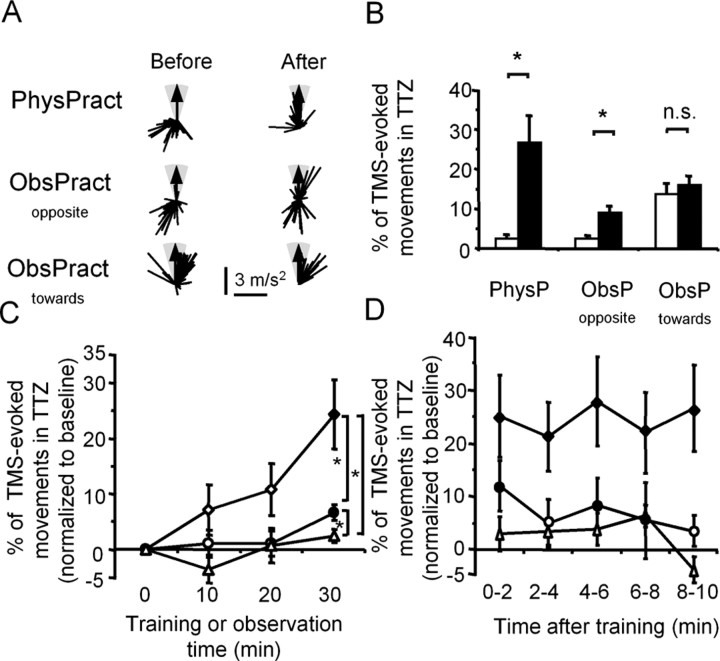
Effect of different training interventions on TMS-evoked movement direction. A, Example of one subject. First-peak acceleration vectors of TMS-evoked thumb movements before (left) and after (right) each of the three interventions (PhysPract, ObsPractopposite, and ObsPracttoward). For better comparability, all examples are aligned to the training direction indicated by the arrow. The TTZ is shown in gray. PhysPract and ObsPractopposite, but not ObsPracttoward, led to substantial changes in the direction of TMS-evoked movements. B, Group data (n = 10) showing the PTTZ before and after PhysPract, ObsPractopposite, and ObsPracttoward. Before the training interventions, the percentage of TMS-evoked movements in TTZ was similar in PhysPract and ObsPractopposite. PhysPract and ObsPractopposite, but not ObsPracttoward, led to a significant increase in the percentage of TMS-evoked movements falling into TTZ. Data show means ± SEM. *p < 0.005. n.s., Not significant. C, Time course of changes of PTTZ as a function of training intervention. To compare between conditions, ΔPTTZ was computed as the baseline-normalized, intervention-dependent change in percentage of TMS-evoked thumb movements falling into the TTZ (see Materials and Methods). At the end of 30 min, the percentage change of TMS-evoked movements in TTZ was larger in PhysPract than in ObsPractopposite or ObsPracttoward and with ObsPractopposite than with ObsPracttoward. Rhombi, PhysPract; circles, ObsPractopposite; triangles, ObsPracttoward. Filled symbols, Time points significantly different from baseline; two-tailed t tests; false discovery rate correction. *p < 0.05. D, Duration of changes of PTTZ as a function of training intervention. Symbols as in C. Error bars represent SEM.

