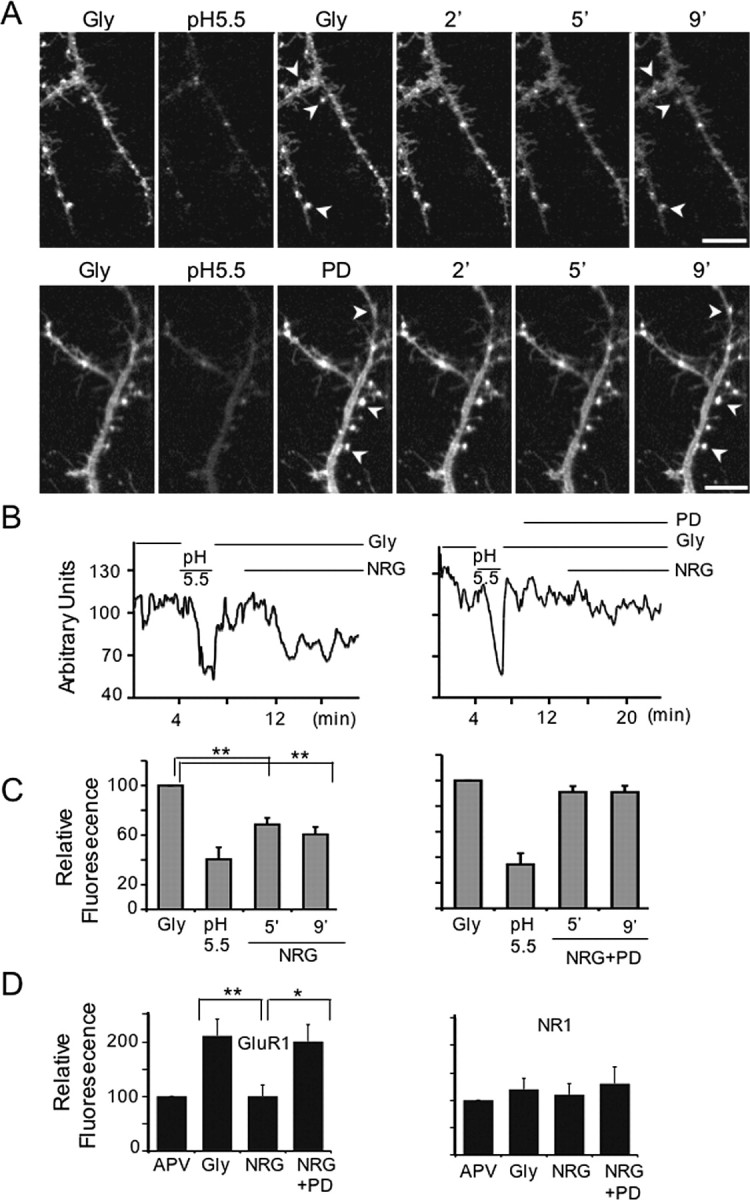
Figure 4.

Effects of NRG-1 on transfected and native surface GluR1 AMPARs in hippocampal neurons. A, Representative micrograph series of neuronal processes imaged after chemLTP induction (Gly), pH 5.5 incubation, and 2, 5, and 9 min of treatment with NRG-1β (top) or NRG1 plus PD158780 (bottom). Arrowheads indicate the same areas before and during treatment. Scale bar, 4 μm. B, Representative line graphs of recording sessions of cultures perfused with NRG-1 (left) or NRG-1 plus PD158780 (right). The horizontal bars indicate duration of treatments. C, Quantitative analysis of seGFP-GluR1 surface expression treated with NRG-1β (left; N = 6; n = 20 ROI) or NRG-1β plus PD158780 (right; N = 5; n = 17 ROI). The intensities per 20 μm of neurite process were averaged from random ROI over 14 frames (70 s). D, Relative levels of native surface GluR1-containing AMPARs and NMDARs detected by dual immunofluorescence to GluR1 and NR1 subunits, respectively. Expression was quantified by measuring fluorescence intensities in 25 μm of dendrite (N = 5; n = 60-90 ROI per treatment). Values are normalized to APV-treated cultures (APV). Data for C and D represent the mean ± SEM (*p < 0.05; **p < 0.01; one-way ANOVA). Gly, Glycine; PD, PD158780.
