
Figure 4.
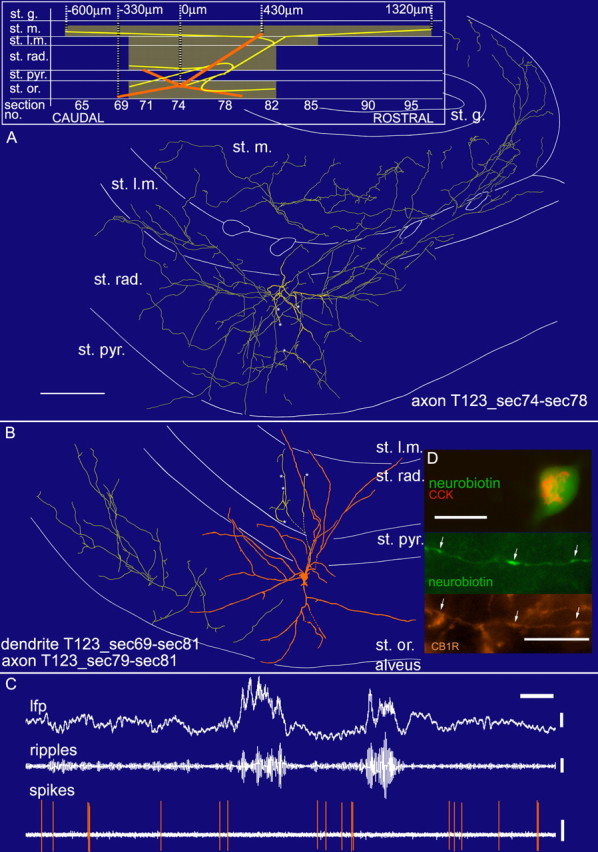
In vivo firing patterns and visualization of a CCK-expressing perforant-path-associated cell (T123b). A, B, Reconstruction of the soma and dendrites (orange) is shown complete; the axon (yellow) is shown from selected series of sections as indicated (bottom section number marks more caudal position). Asterisks mark the continuation of the main axon in A and B. Scale bar, 100 μm. Laminar boundaries are adjusted to reflect the position of processes as far as possible, but because of the tangential cutting plane, boundaries strongly shifted from section to section. A schematic sagittal view representing the cell shows rostrocaudal dimensions. C, In vivo firing pattern of the cell. Note the absence of firing during ripple episodes. Calibration: lfp, 0.5 mV, 0.2 s; ripples, 0.1 mV; spikes, 0.5 mV. D, Immunofluorescence micrographs of the cell labeled by neurobiotin (green) showing CCK immunoreactivity (red) in the soma and immunoreactivity for the cannabinoid receptor CB1 (orange) in the axonal membrane. Immunopositive axons from unlabeled cells are also evident. Scale bars: top, 20 μm; bottom, 10 μm. st. rad., Stratum radiatum; st. pyr., stratum pyramidale; st. l.m., stratum lacunosum moleculare; st. m., stratum moleculare; st. g., stratum granulosum; st. or., stratum oriens; sec., section; no., number.