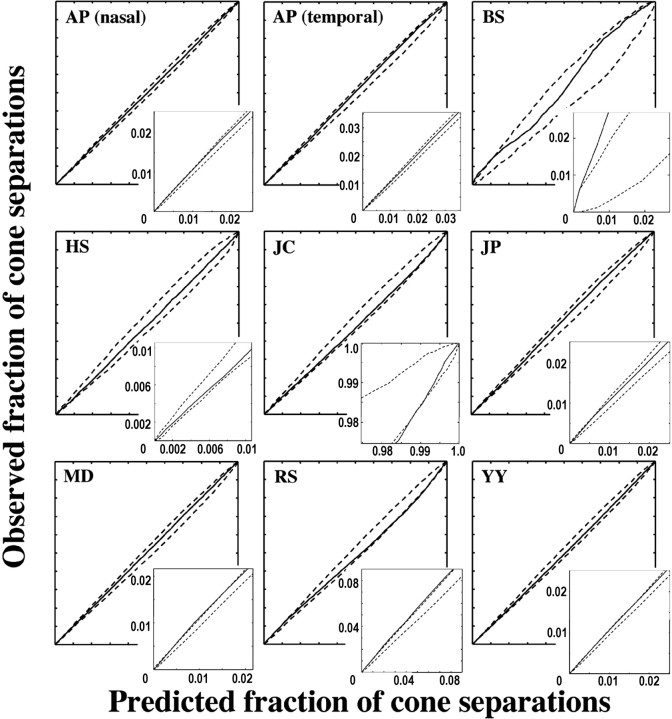
Figure 9.
Cumulative histogram comparison plots for the M-cone submosaic (L-cone submosaic for HS). The solid line is the fraction of intercone separations within a particular distance value for the actual mosaic versus that for the average of 100 random simulations. The dashed lines represent the maximum and minimum bounds of the random simulations. If the solid line lies entirely between the two dashed, lines then L- and M-cone arrangement is indistinguishable from random.

