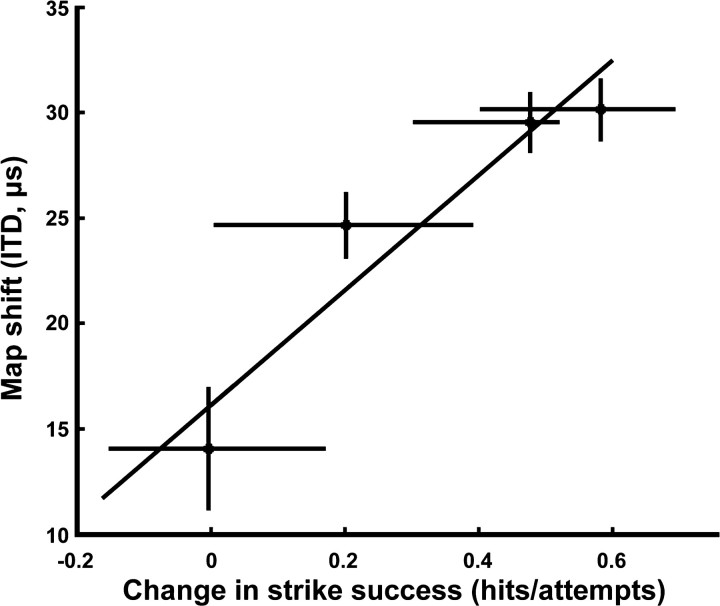
Figure 3.
Average map shift of individual owls as a function of the change in strike success. The diagonal line represents the linear correlation of improvement in strike success (final strike success - initial strike success) with the magnitude of auditory map plasticity (r2 = 0.90; p < 0.05). Error bars for both strike success and map shift are the 95% confidence intervals on the measurements.

