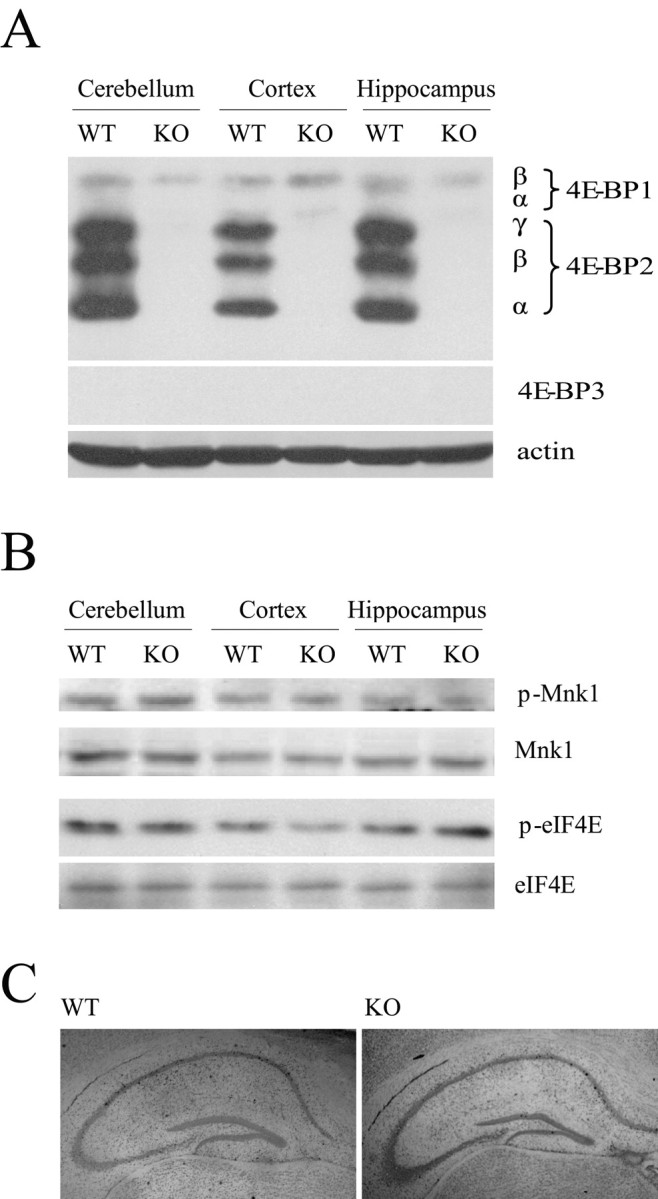
Figure 2.

General characterization of 4E-BP2 knock-out mice. A, Representative Western blot analysis of 4E-BP1, 4E-BP2, 4E-BP3, and actin in different brain regions obtained from wild-type or knock-out mice. α, β, and γ identify 4E-BP1 and 4E-BP2 phosphorylation isoforms that exhibit different electrophoretic mobilities in SDS-PAGE. B, Representative Western blot analysis of phosphorylated and total protein levels of eIF4E and Mnk1 in different brain regions show no difference. C, Representative cresyl violet staining of hippocampal cell bodies in slices obtained from wild-type (left) and knock-out (right) mice show no difference. WT, Wild type; KO, knock-out.
